SNIS189D June 2015 – June 2018 LMT01
PRODUCTION DATA.
- 1 Features
- 2 Applications
- 3 Description
- 4 Revision History
- 5 Pin Configuration and Functions
-
6 Specifications
- 6.1 Absolute Maximum Ratings
- 6.2 ESD Ratings
- 6.3 Recommended Operating Conditions
- 6.4 Thermal Information
- 6.5 Electrical Characteristics
- 6.6 Electrical Characteristics - TO-92/LPG Pulse Count to Temperature LUT
- 6.7 Electrical Characteristics - WSON/DQX Pulse Count to Temperature LUT
- 6.8 Switching Characteristics
- 6.9 Timing Diagram
- 6.10 Typical Characteristics
- 7 Detailed Description
- 8 Application and Implementation
- 9 Power Supply Recommendations
- 10Layout
- 11Device and Documentation Support
- 12Mechanical, Packaging, and Orderable Information
Package Options
Mechanical Data (Package|Pins)
Thermal pad, mechanical data (Package|Pins)
- DQX|2
Orderable Information
7.3.2 Output Transfer Function
TheLMT01 outputs at minimum 1 pulse and a theoretical maximum 4095 pulses. Each pulse has a weight of 0.0625°C. One pulse corresponds to a temperature less than –50°C while a pulse count of 4096 corresponds to a temperature greater than 200°C. Note that the LMT01 is only ensured to operate up to 150°C. Exceeding this temperature by more than 5°C may damage the device. The accuracy of the device degrades as well when 150°C is exceeded.
Two different methods of converting the pulse count to a temperature value are discussed in this section. The first method is the least accurate and uses a first order equation, and the second method is the most accurate and uses linear interpolation of the values found in the look-up table (LUT) as described in Electrical Characteristics - TO-92/LPG Pulse Count to Temperature LUT.
The output transfer function appears to be linear and can be approximated by Equation 1:

where
- PC is the Pulse Count
- Temp is the temperature reading
Table 1 shows some sample calculations using Equation 1.
Table 1. Sample Calculations Using Equation 1
| TEMPERATURE (°C) | NUMBER OF PULSES |
|---|---|
| –49.9375 | 1 |
| –49.875 | 2 |
| –40 | 160 |
| –20 | 480 |
| 0 | 800 |
| 30 | 1280 |
| 50 | 1600 |
| 100 | 2400 |
| 150 | 3200 |
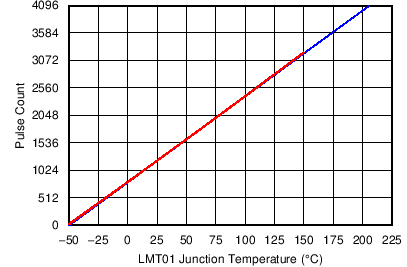
The curve shown in Figure 23 shows the output transfer function using equation Equation 1 (blue line) and the look-up table (LUT) found in Electrical Characteristics - TO-92/LPG Pulse Count to Temperature LUT (red line). The LMT01 output transfer function as described by the LUT appears to be linear, but upon close inspection, it can be seen as truly not linear. To actually see the difference, the accuracy obtained by the two methods must be compared.
 Figure 23. LMT01 Output Transfer Function
For more exact temperature readings the output pulse count can be converted to temperature using linear interpolation of the values found in Electrical Characteristics - TO-92/LPG Pulse Count to Temperature LUT.
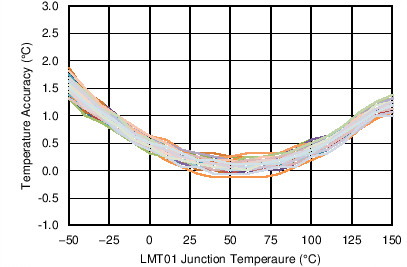
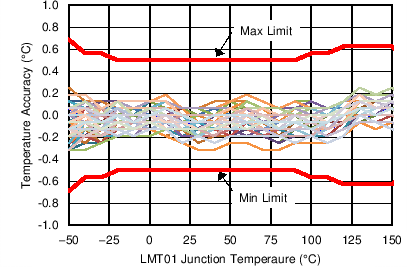
The curves in Figure 24 and Figure 25, show the accuracy of typical units when using the Equation 1 and linear interpolation using Electrical Characteristics - TO-92/LPG Pulse Count to Temperature LUT, respectively. When compared, the improved performance when using the LUT linear interpolation method can clearly be seen. For a limited temperature range of 25°C to 80°C, the error shown in Figure 24 is flat, so the linear equation will provide good results. For a wide temperature range, TI recommends that linear interpolation and the LUT be used.

