SNOSDC7B December 2021 – December 2021 LDC3114-Q1
PRODUCTION DATA
- 1 Features
- 2 Applications
- 3 Description
- 4 Revision History
- 5 Pin Configuration and Functions
- 6 Specifications
-
7 Detailed Description
- 7.1 Overview
- 7.2 Functional Block Diagram
- 7.3 Feature Description
- 7.4 Device Functional Modes
- 7.5 Register Maps
-
8 Application and Implementation
- 8.1
Application Information
- 8.1.1 Theory of Operation
- 8.1.2 Designing Sensor Parameters
- 8.1.3 Setting COM Pin Capacitor
- 8.1.4 Defining Power-On Timing
- 8.1.5 Configuring Button or Raw Data Scan Rate
- 8.1.6 Programming Button or Raw Data Sampling Window
- 8.1.7 Scaling Frequency Counter Output
- 8.1.8 Setting Button Triggering Threshold
- 8.1.9 Tracking Baseline
- 8.1.10 Mitigating False Button Detections
- 8.1.11 Reporting Interrupts for Button Presses, Raw Data Ready and Error Conditions
- 8.1.12 Estimating Supply Current
- 8.2 Typical Application
- 8.1
Application Information
- 9 Power Supply Recommendations
- 10Layout
- 11Device and Documentation Support
- 12Mechanical, Packaging, and Orderable Information
Package Options
Mechanical Data (Package|Pins)
- PW|16
Thermal pad, mechanical data (Package|Pins)
Orderable Information
8.1.1 Theory of Operation
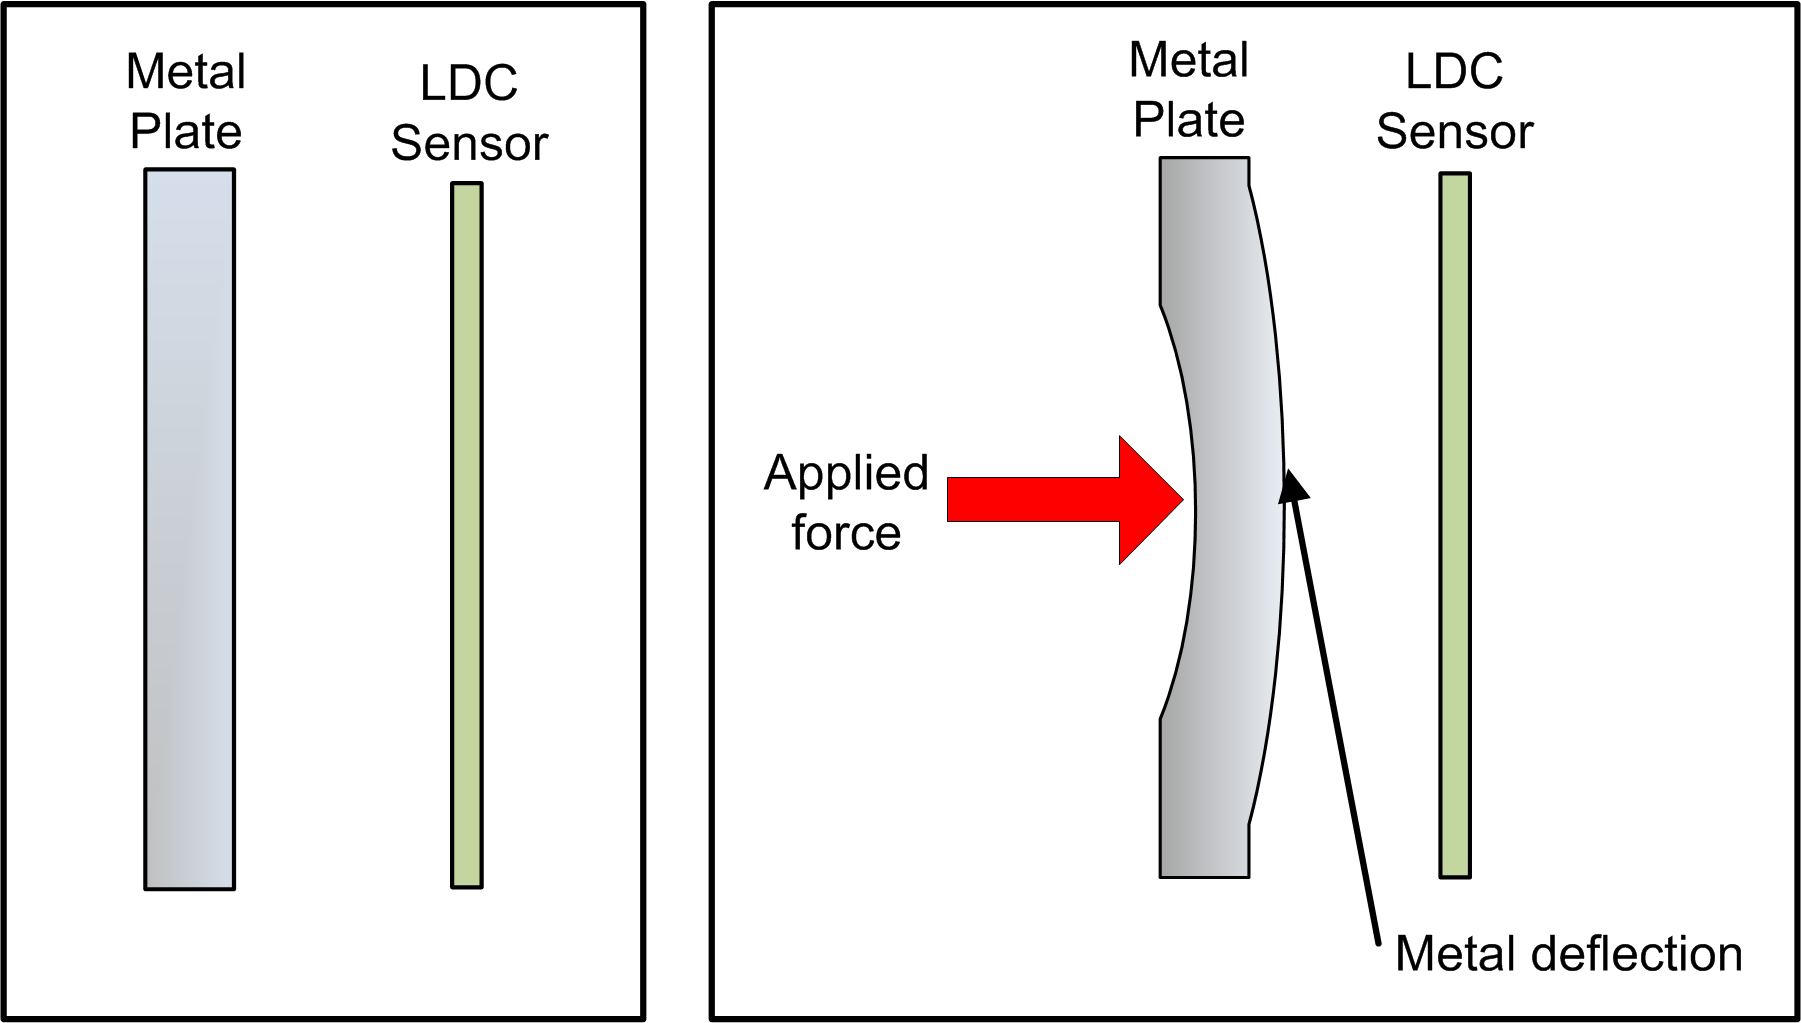
An AC current flowing through an inductor will generate an AC magnetic field. If a conductive material, such as a metal object, is in close proximity to the inductor, the magnetic field will induce circulating eddy currents on the surface of the conductor. The eddy currents are a function of the distance, size, and composition of the conductor. If the conductor is deflected toward the inductor as shown in Figure 8-1, more eddy currents will be generated.
 Figure 8-1 Metal Deflection
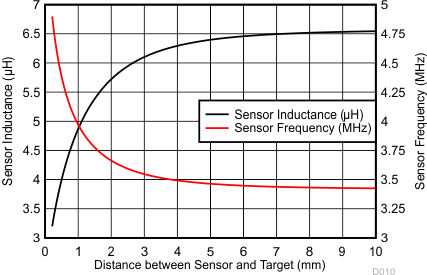
The eddy currents create their own magnetic field, which opposes the original field generated by the inductor. This effect reduces the effective inductance of the system, resulting in an increase in sensor frequency. Figure 8-2 shows the inductance and frequency response of an example sensor with a diameter of 14 mm. As the sensitivity of an inductive sensor increases with closer targets, the conductive plate should be placed quite close to the sensor—typically 10% of the sensor diameter for circular coils. For rectangular or race-track-shaped coils, the target to sensor distance should typically be less than 10% of the shorter side of the coil.
 Figure 8-2 Sensor Inductance and
Frequency vs. Target Distance. Sensor Diameter = 14 mm
Figure 8-2 Sensor Inductance and
Frequency vs. Target Distance. Sensor Diameter = 14 mmThe output DATAn registers (Addresses 0x02 through 0x09) of the LDC3114-Q1 contain the processed values of the changes in sensor frequencies.