SNIS192C November 2016 – June 2018 LMT01-Q1
PRODUCTION DATA.
- 1 Features
- 2 Applications
- 3 Description
- 4 Revision History
- 5 Pin Configuration and Functions
-
6 Specifications
- 6.1 Absolute Maximum Ratings
- 6.2 ESD Ratings
- 6.3 Recommended Operating Conditions
- 6.4 Thermal Information
- 6.5 Electrical Characteristics
- 6.6 Electrical Characteristics - TO-92/LPG Pulse Count to Temperature LUT
- 6.7 Electrical Characteristics - WSON/DQX Pulse Count to Temperature LUT
- 6.8 Switching Characteristics
- 6.9 Timing Diagram
- 6.10 Typical Characteristics
- 7 Detailed Description
- 8 Application and Implementation
- 9 Power Supply Recommendations
- 10Layout
- 11Device and Documentation Support
- 12Mechanical, Packaging, and Orderable Information
Package Options
Mechanical Data (Package|Pins)
Thermal pad, mechanical data (Package|Pins)
- DQX|2
Orderable Information
8.1.1 Mounting, Temperature Conductivity, and Self-Heating
The LMT01-Q1 can be applied easily in the same way as other integrated-circuit temperature sensors. It can be glued or cemented to a surface to ensure good temperature conductivity. The temperatures of the lands and traces to the leads of the LMT01-Q1 also affect the temperature reading, so they must be a thin as possible.
Alternatively, the LMT01-Q1 can be mounted inside a sealed-end metal tube, and then can be dipped into a bath or screwed into a threaded hole in a tank. As with any IC, the LMT01-Q1 and accompanying wiring and circuits must be kept insulated and dry to avoid excessive leakage and corrosion. Printed-circuit coatings are often used to ensure that moisture cannot corrode the leads or circuit traces.
The junction temperature of the LMT01-Q1 is the actual temperature being measured by the device. The thermal resistance junction-to-ambient (RθJA) is the parameter (from Thermal Information) used to calculate the rise of a device junction temperature (self-heating) due to its average power dissipation. The average power dissipation of the LMT01-Q1 is dependent on the temperature it is transmitting as it effects the output pulse count and the voltage across the device. Equation 4 is used to calculate the self-heating in the die temperature of the LMT01-Q1 (TSH).

where
- TSH is the ambient temperature
- IOL and IOH are the output low and high current level, respectively
- VCONV is the voltage across the LMT01-Q1 during conversion
- VDATA is the voltage across the LMT01-Q1 during data transmission
- tCONV is the conversion time
- tDATA is the data transmission time
- PC is the output pulse count
- RθJA is the junction to ambient package thermal resistance
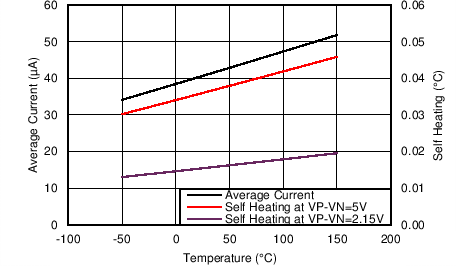
Plotted in the curve Figure 21 are the typical average supply current (black line using left y axis) and the resulting self-heating (red and violet lines using right y axis) during continuous conversions. A temperature range of –50°C to +150°C, a VCONV of 5 V (red line) and 2.15 V (violet line) were used for the self-heating calculation. As can be seen in the curve, the average power supply current and thus the average self-heating changes linearly over temperature because the number of pulses increases with temperature. A negligible self-heating of about 45m°C is observed at 150°C with continuous conversions. If temperature readings are not required as frequently as every 100 ms, self-heating can be minimized by shutting down power to the part periodically thus lowering the average power dissipation.
 Figure 21. Average Current Draw and Self-Heating Over Temperature