SBOS925D December   2020  – April 2024 OPA2391 , OPA391

PRODMIX  

  1.   1
  2. Features
  3. Applications
  4. Description
  5. Pin Configuration and Functions
  6. Specifications
    1. 5.1 Absolute Maximum Ratings
    2. 5.2 ESD Ratings
    3. 5.3 Recommended Operating Conditions
    4. 5.4 Thermal Information: OPA391
    5. 5.5 Thermal Information: OPA2391
    6. 5.6 Thermal Information: OPA4391
    7. 5.7 Electrical Characteristics: OPA391DCK and OPA2391YBJ
    8. 5.8 Electrical Characteristics: OPA4391PW
    9. 5.9 Typical Characteristics
  7. Detailed Description
    1. 6.1 Overview
    2. 6.2 Functional Block Diagram
    3. 6.3 Feature Description
      1. 6.3.1 Low Input Bias Current
      2. 6.3.2 Input Differential Voltage
      3. 6.3.3 Capacitive Load Drive
      4. 6.3.4 EMI Rejection
    4. 6.4 Device Functional Modes
  8. Application and Implementation
    1. 7.1 Application Information
    2. 7.2 Typical Applications
      1. 7.2.1 Three-Terminal CO Gas Sensor
        1. 7.2.1.1 Design Requirements
        2. 7.2.1.2 Detailed Design Procedure
        3. 7.2.1.3 Application Curve
      2. 7.2.2 4-mA to 20-mA Loop Design
        1. 7.2.2.1 Application Curve
    3. 7.3 Power Supply Recommendations
    4. 7.4 Layout
      1. 7.4.1 Layout Guidelines
      2. 7.4.2 Layout Example
  9. Device and Documentation Support
    1. 8.1 Device Support
      1. 8.1.1 Development Support
        1. 8.1.1.1 PSpice® for TI
        2. 8.1.1.2 TINA-TI™ Simulation Software (Free Download)
    2. 8.2 Documentation Support
      1. 8.2.1 Related Documentation
    3. 8.3 Receiving Notification of Documentation Updates
    4. 8.4 Support Resources
    5. 8.5 Trademarks
    6. 8.6 Electrostatic Discharge Caution
    7. 8.7 Glossary
  10. Revision History
  11. 10Mechanical, Packaging, and Orderable Information

Package Options

Refer to the PDF data sheet for device specific package drawings

Mechanical Data (Package|Pins)
  • DCK|5
Thermal pad, mechanical data (Package|Pins)
Orderable Information

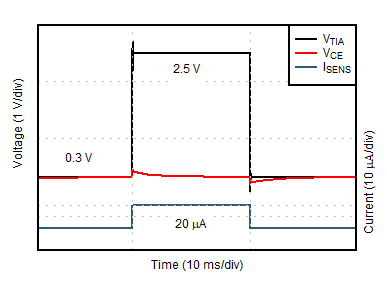
Application Curve

GUID-20201117-CA0I-18JF-KWN2-T55QWWDTHQXS-low.gifFigure 7-3 Sensor Transient Response to Simulated 300-ppm CO Exposure