SBAA436 March 2021 REF34-Q1 , REF3425 , REF3425-EP , REF3430 , REF3430-EP , REF3433 , REF3433-EP , REF3440 , REF3440-EP , REF3450 , REF4132 , REF4132-Q1 , REF5010 , REF5020 , REF5020-EP , REF5020A-Q1 , REF5025 , REF5025-EP , REF5025-HT , REF5025A-Q1 , REF5030 , REF5030A-Q1 , REF5040 , REF5040-EP , REF5040A-Q1 , REF5045 , REF5045A-Q1 , REF5050 , REF5050-EP , REF5050A-Q1 , REF6125 , REF6133 , REF6141 , REF6145 , REF6150 , REF6225 , REF6230 , REF6233 , REF6241 , REF6245 , REF6250 , REF70
2 Long-Term Drift Data Sheet Measurement
Long term drift (LTD) for voltage references give insight of its output behavior over long period of time in a quantitative manner. Long-Term Drift Equation shows how Long-Term Drift is typically defined in a data sheet electrical characteristics table.
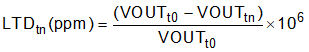
Where:
- VOUTt0 = Output voltage at the start of measurement. This is done right after soldering.
- VOUTtn = Output voltage at nth hour
During this measurement the reference was powered up for n hours.
The resulting value is then captured in the data sheet in Figure 2-1 based on the amount of time tested and measured. LTD is not production tested; therefore the value specified is a typical value that will have variation across devices. Examples of variations can be found in the typical characteristic graphs in the data sheet. This table shows two LTD values based on two time subdivisions from the same continuous test for the DBV package, the first 1000 hours and the subsequent 1000 hours for a total of 2000 hours.
 Figure 2-1 Long-Term Drift Data Sheet Table
Example for REF34-Q1
Figure 2-1 Long-Term Drift Data Sheet Table
Example for REF34-Q1The LTD specification in the electrical characteristics table can be used for generic error calculations but the graphs in the data sheet show the actual trend over time. The graphs illustrate that the drift is not consistent in value or direction from unit to unit but generally the drift slows over time. The LTD primarily comes from the mechanical stress and aging, so as the packaging, bonding and die materials settle over time, the drift will slow down.