SLUUCI9A January 2022 – December 2022 UCC28781
- Abstract
- Trademarks
- 1 Introduction
- 2 General Texas Instruments High Voltage Evaluation (TI HV EVM) User Safety Guidelines
- 3 Description of EVM
- 4 Electrical Performance Specifications of EVM
- 5 Schematic Diagram of EVM
- 6 Operating the EVM from a DC or an AC Source
- 7 Test Set-ups
-
8 Performance Data and Typical Characteristic Curves
- 8.1 Table of Efficiency Measurements with DC Input
- 8.2 Table of Efficiency Measurements with AC Input
- 8.3 Efficiency Graphs with DC Input Voltage (Typical Results)
- 8.4 Switching Frequencies in Various Operating Modes
- 8.5 Key Switching Waveforms and Operating Mode Load Current
- 8.6 Thermal Images at Full Load (15 V, 4.0 A) with DC and AC Inputs
- 9 Transformer Details
- 10EVM Assembly and Layout
- 11List of Materials
- 12Revision History
8.5 Key Switching Waveforms and Operating Mode Load Current
This section shows a table of typical load-current ranges within each operating mode in this design, at Vin = 250 VDC and IFL_HI range as an example. Following the table are typical waveforms seen while in each of the operating modes of Table 8-3. Hysteresis between modes results in differences between the modes' current ranges when load is decreasing compared to when load is increasing.
- AAM: Adaptive Amplitude Modulation
- ABM: Adaptive Burst Mode
- LPM: Low Power Mode
- SBP1: First Standby Power Mode
- SBP2: Second Standby Power Mode
Table 8-3 Operating Modes and Load Currents at
250-VDC Input; Output in IFL_HI Range
| Mode: | AAM | ABM | LPM | SBP1 | SBP2 |
|---|---|---|---|---|---|
| Typical Load Current (Decreasing) | 4.0 A to 1.3 A | 1.3 A to 0.41 A | 0.41 A to 0.22 A | 0.22 A to 0.09 A | 0.09 A to 0 A |
| Typical Load Current (Increasing) | 1.8 A to 4.0 A | 0.53 A to 1.8 A | 0.23 A to 0.53 A | 0.14 A to 0.23 A | 0 A to 0.14 A |
| Burst Frequency, fBUR (pulses per burst) | Not Applicable | > 25 kHz (9 to 2 pulses) |
about 25 kHz (2 pulses) |
8.5 kHz to 25 kHz (2 pulses) |
< 8.5 kHz (2 pulses) |
In the following waveforms, Ch4 (green) = Transformer Primary Winding Current at 1 A/div, Ch2 (blue) = VDS of SR-Mosfet at 20 V/div (AC-coupled).
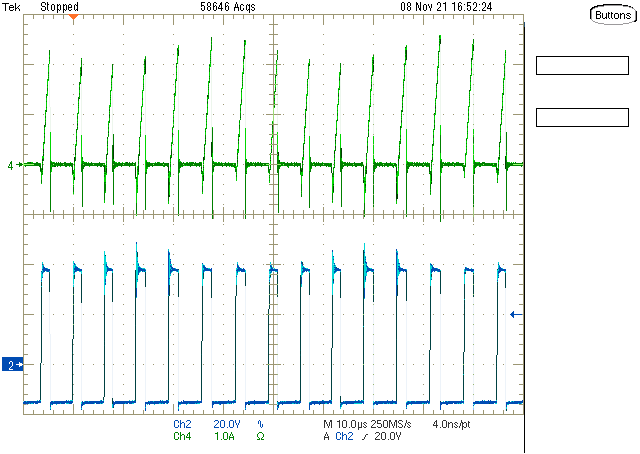 Figure 8-8 Typcial Waveform in AAM Operation (Sweep = 10 μs/div)
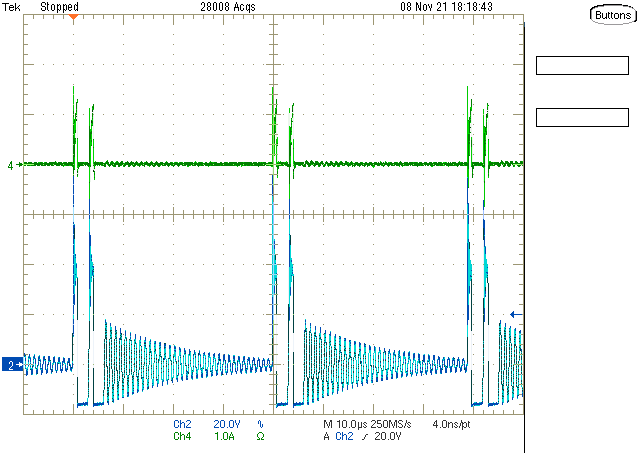 Figure 8-10 Typical Waveform in LPM
Operation (Sweep = 10 μs/div)
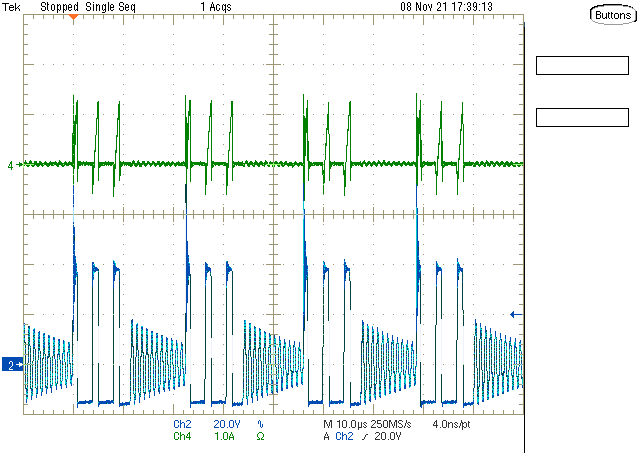 Figure 8-9 Typical Waveform in ABM Operation (Sweep = 10 μs/div)
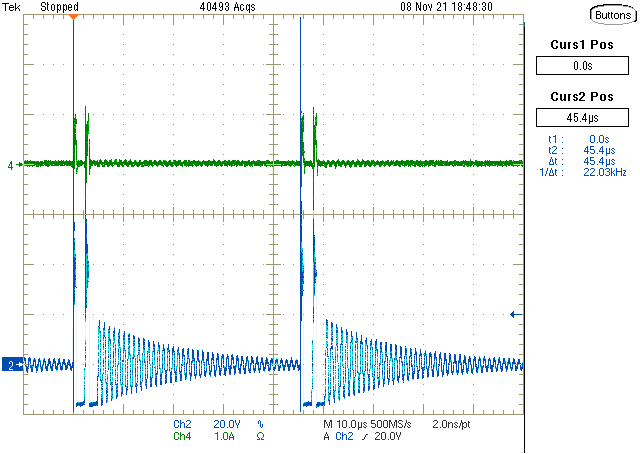 Figure 8-11 Typical Waveform in SBP1
Operation (Sweep = 10 μs/div)
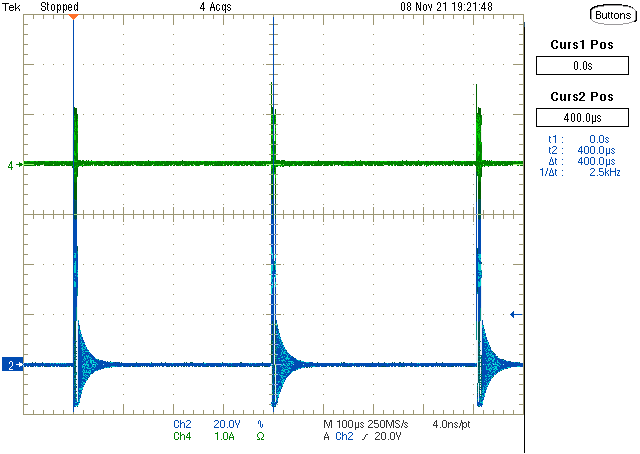 Figure 8-12 Typical Waveform in SBP2
Operation (Sweep = 100 μs/div)
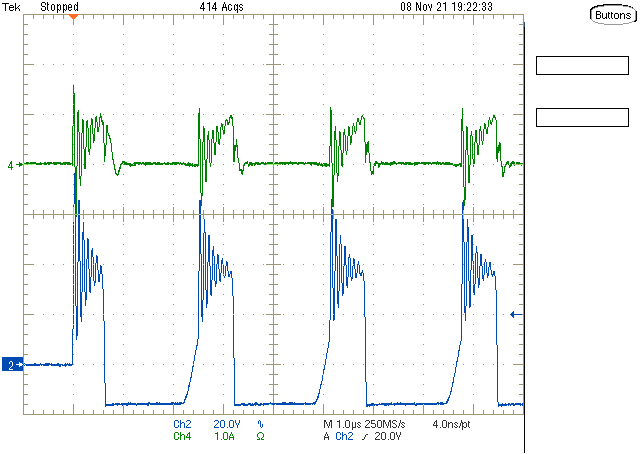 Figure 8-13 Typical Waveform in SBP2
Operation, Burst Detail (Sweep = 1 μs/div)