TIDT248A December 2021 – March 2023 TMUXHS4412
2.5 EMI
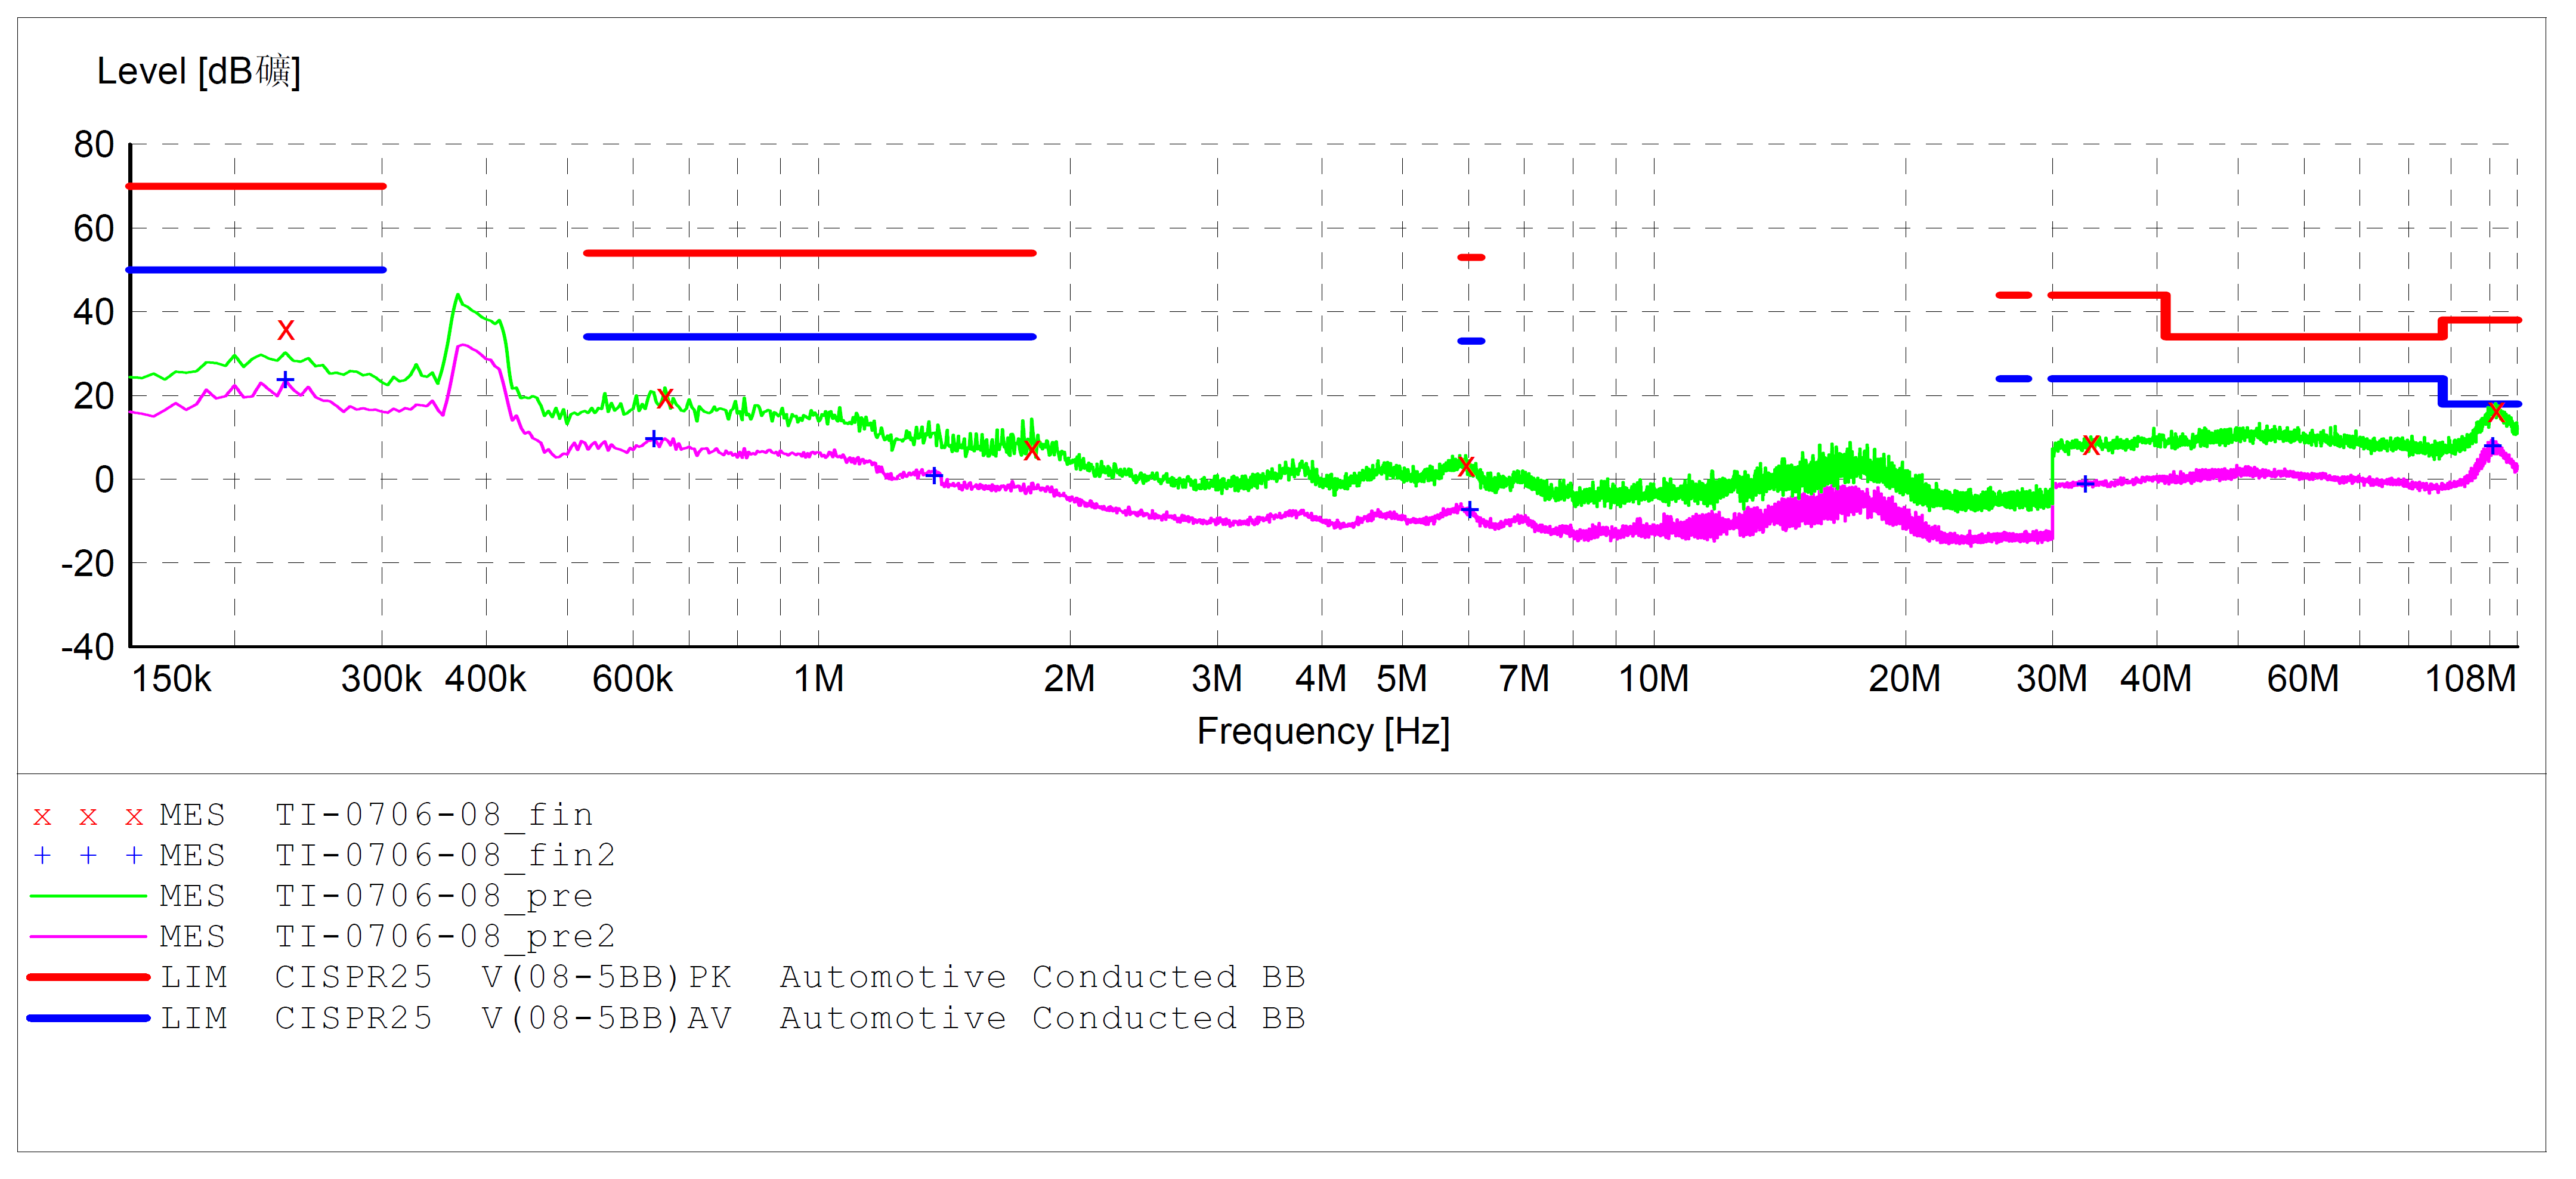
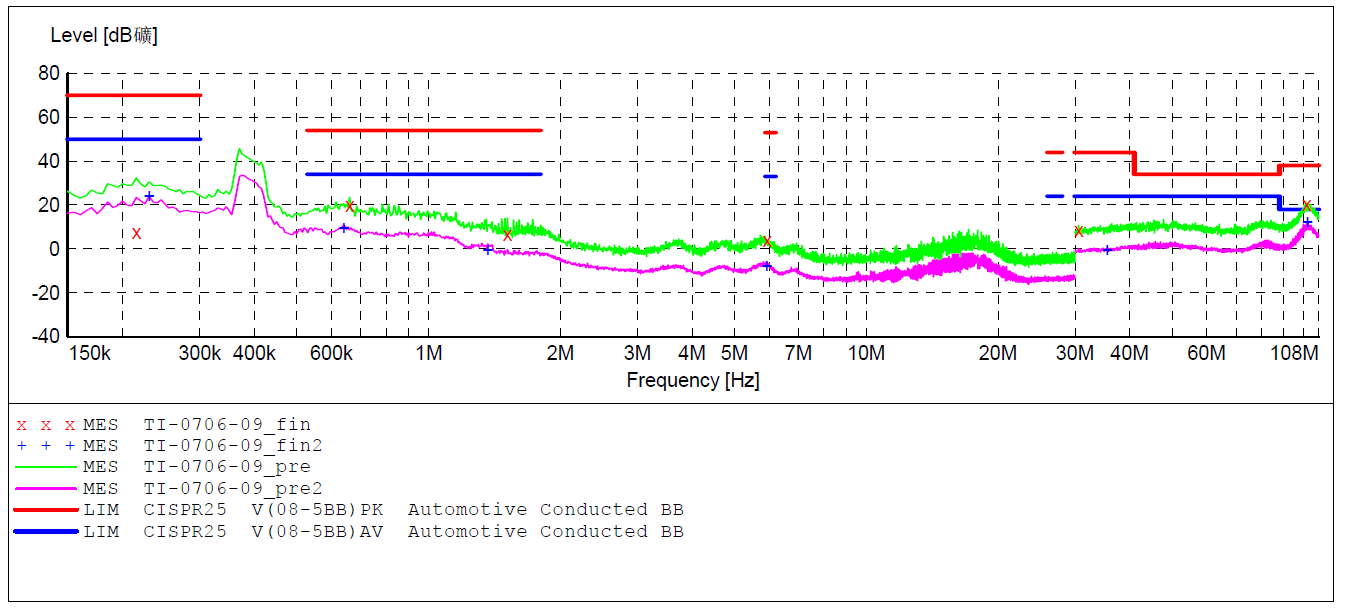
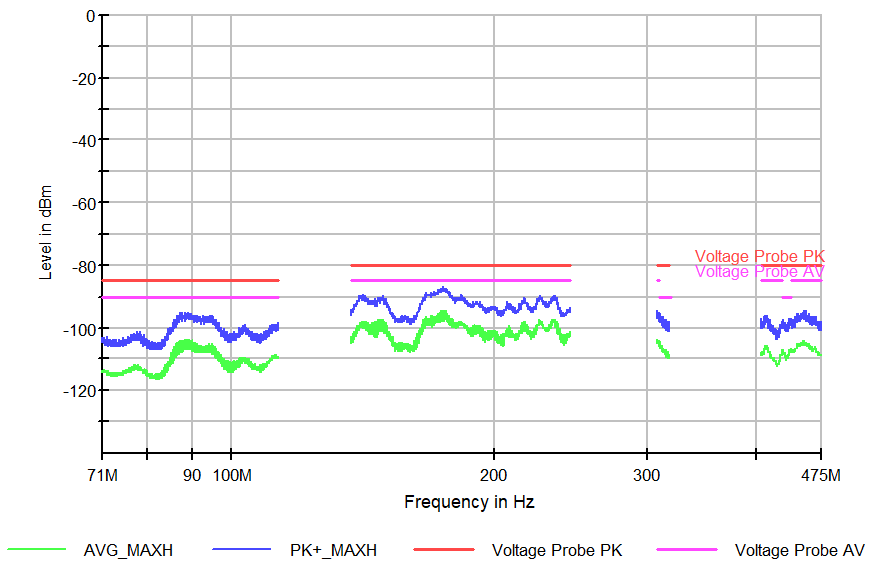
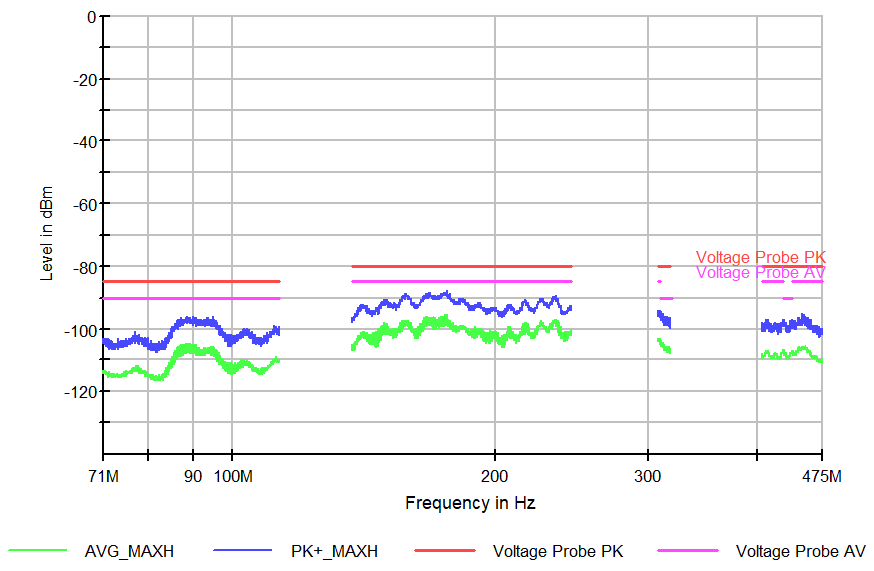
The conducted emissions are tested to the CISPR 25 class 5 and Toyota TSC 0505G:2019 standards. The CISPR 25 class 5 and Toyota TSC 0505G:2019 compliance were achieved without a common-mode choke. The waveforms of EMI test results are shown in following images.
Figure 2-4 and Figure 2-5 illustrate CISPR 25 Class 5 EMI performance from 150 kHz to 108 MHz, and the data was also collected under the following conditions:
- VIN = 12 V
- IO = 3 A

Green: peak detection result;
Purple: average detection result
Red: CISPR 25 Class 5 peak limits;
Blue: CISPR 25 Class 5 average limits
Figure 2-4 DC+
Green: peak detection result;
Purple: average detection result
Red: CISPR 25 Class 5 peak limits;
Blue: CISPR 25 Class 5 average limits
Figure 2-5 DC–Figure 2-6 and Figure 2-7 Toyota TSC 0505G:2019 EMI performance from 71 MHz to 475 MHz, and the data was also collected under the following conditions:
- VIN = 12 V
- IO = 3 A

Blue: peak detection result; Green:
average detection result
Red: Toyota TSC 0505G:2019 peak
limits; Purple: Toyota TSC 0505G:2019 average limits
Figure 2-6 DC+
Blue: peak detection result; Green:
average detection result
Red: Toyota TSC 0505G:2019 peak
limits; Magenta: Toyota TSC 0505G:2019 average limits
Figure 2-7 DC–