SBAU362 March   2021 ADS1015 , ADS1115


  1.   Trademarks
  2. 1Introduction
  3. 2Quick Start
    1. 2.1 Step 1 - Hardware Setup
    2. 2.2 Step 2 - USB Connection and GUI Startup
    3. 2.3 Step 3 - Configuration and Data Collection
  4. 3ADS1x15EVM Overview
    1. 3.1 ADS1x15EVM-to-PAMBoard Interface
    2. 3.2 Digital Interface
    3. 3.3 Analog Input Connections
    4. 3.4 Power-Supply Options
  5. 4ADS1x15V2EVM-PDK Setup and Operation
    1. 4.1 EVM Plug-In Instructions
    2. 4.2 ADS1x15EVM GUI and TI Cloud Agent Installation
  6. 5ADS1x15V2EVM-PDK GUI
    1. 5.1 Menu Bar
      1. 5.1.1 File Menu
      2. 5.1.2 Options Menu
      3. 5.1.3 Tools Menu
      4. 5.1.4 Help Menu
    2. 5.2 Navigation Bar
      1. 5.2.1 Home
      2. 5.2.2 Chart
        1. 5.2.2.1 Channel Statistics
          1. 5.2.2.1.1 Time Domain and Histogram Statistics
          2. 5.2.2.1.2 FFT Statistics
        2. 5.2.2.2 Time Domain Plot
        3. 5.2.2.3 Histogram Plot
        4. 5.2.2.4 FFT Plot
        5. 5.2.2.5 Capture Configuration Settings
      3. 5.2.3 Configuration
        1. 5.2.3.1 Register Read and Write Options
          1. 5.2.3.1.1 Read Register Options
          2. 5.2.3.1.2 Write Register Options
    3. 5.3 Connection Status
  7. 6Bill of Materials, Printed Circuit Board Layout, and Schematics
    1. 6.1 Bill of Materials
    2. 6.2 Printed Circuit Board Layout
    3. 6.3 Schematics

Time Domain Plot

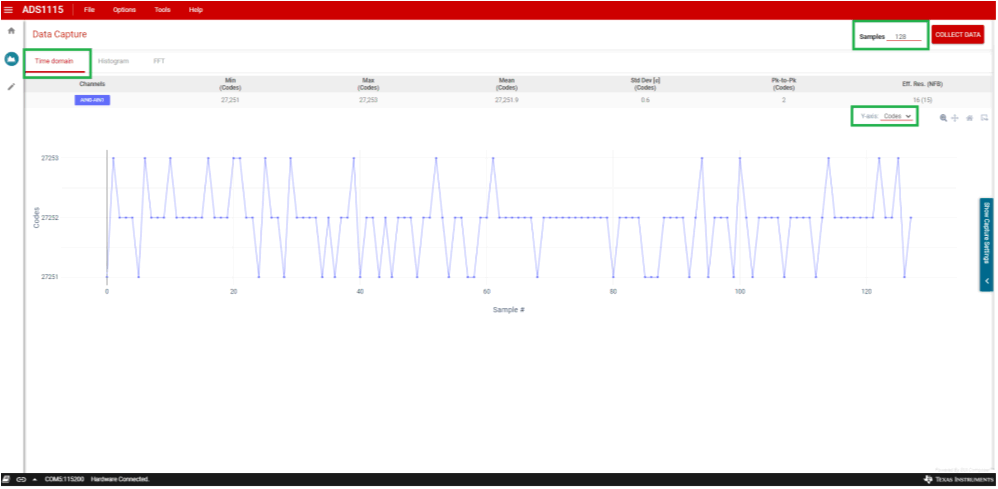
The Time Domain plot (shown in Figure 5-17) displays the sample count number in the X-axis. The Y-axis is displayed as either codes or volts with the selection in a drop-down menu. The Y-axis drop-down menu displays next to the charting icons near the right side of the GUI below the statistics.
GUID-20210317-CA0I-J1M9-H6WS-6MDKWKRLWRDP-low.gifFigure 5-17 Time Domain Plot