SLAA843A August 2018 – March 2019 MSP430FR2512 , MSP430FR2512 , MSP430FR2522 , MSP430FR2522 , MSP430FR2532 , MSP430FR2532 , MSP430FR2533 , MSP430FR2533 , MSP430FR2632 , MSP430FR2632 , MSP430FR2633 , MSP430FR2633
6.1 Count and Percent Change Analysis With 7.5-mm Overlay, Advice = POOR
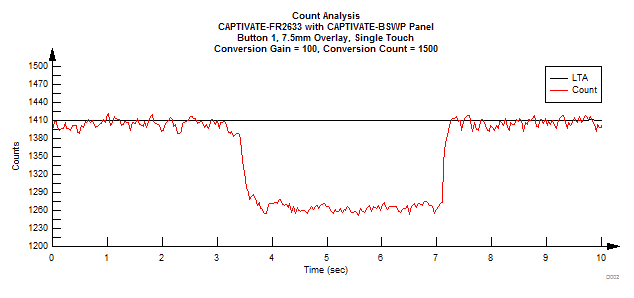
Because the capacitive touch sensing process involves a change in capacitance over time, the capacitive touch software must maintain a reference value that represents the untouched capacitance. This reference value is a slow moving average referred to as the long-term average, or LTA. Each new sample is compared against this moving average to determine if a touch is present or not. Figure 10 shows the count and the long-term average of the test hardware with a 7.5-mm overlay when a touch is applied and then removed. Note that the count value (the conversion result) decreases from the long-term average value of approximately 1410 to approximately 1264 (a change of approximately 146 counts). Some noise is also present in this particular measurement.
 Figure 10. Count Analysis With 7.5-mm Overlay
 To determine the signal 'S' and noise 'N' parameters for this data set, the count and LTA values must be converted into a percent change in capacitance format. This is necessary, because the CapTIvate analog front end has a programmable offset feature to amplify small changes in capacitance. The 1410 to 1264 count change due to a touch is a –10% change in counts. However, this is not the change in capacitance. The change in counts appears larger than the change in capacitance, because offset is applied in the conversion to remove the effect of some of the electrode's parasitic capacitance (Cp). Equation 9 shows the relationship between counts and percent change.
In this equation, the Conversion_Gain parameter is taken from CapTIvate Design Center, and the LTA and count are taken from the data set. Applying this equation to the LTA an count values in the previous example gives the result in Figure 11.
Example: Signal Percent Change in Capacitance = [(100/1264) – (100/1410)] × 100% = 0.82%. Note that a decrease in counts represents an increase in capacitance, which is why the direction of change due to a touch appears to flip.
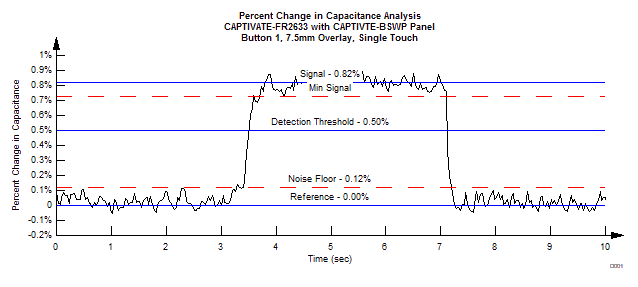
 Figure 11. Percent Change Analysis With 7.5-mm Overlay
 The application of Equation 9 in Figure 11 provides a clear picture of how the electrode's capacitance changed as a result of the touch. As can be seen in the figure, the touch created an average change in capacitance of 0.82%. Also note that the noise level in the direction of a touch was as high as 0.12% in this example. These values provide the signal 'S' and noise 'N' respectively. It is now possible to compute an SNR for this example.
With 'S', 'N', and SNR now available, a detection threshold can be placed and the design margin can be analyzed. Design margin provides more information than SNR for capacitive touch applications, because it indicates the margin between the highest noise levels and the detection threshold. This provides insight into false detection risk. The reason this needs to be considered along with SNR is that if the detection threshold is set to a smaller than normal value for some reason, the SNR does not change but the false detection risk does (because the distance between the noise floor and the detection threshold is smaller).
Figure 11 shows that the Threshold (Th) = 0.5%. Based on Table 4, the minimum recommended threshold for 0°C operating temperature is 0.9%. This means that if this example is designed to operate down to 0°C then the SNR analyze tool will give an advice as POOR.
Equation 11 calculates the Min in this example. In this example, the Min of 0.38% is also lower than the minimum recommended margin in 0.83% as showing in Table 4. This means that if this example is designed to operate down to 0°C then the SNR analyze tool will give an advice as POOR.
Equation 12 calculates the Mout. This is the difference between the lowest percent change during a touch and the detection threshold.