SLAA843A August 2018 – March 2019 MSP430FR2512 , MSP430FR2512 , MSP430FR2522 , MSP430FR2522 , MSP430FR2532 , MSP430FR2532 , MSP430FR2533 , MSP430FR2533 , MSP430FR2632 , MSP430FR2632 , MSP430FR2633 , MSP430FR2633
2.1 Run SNR and Design Margin Tests
During the prototyping phase, use the CapTIvate Design Center development tool to measure the SNR and design margins for each touch sensor in the application. This must be done to determine whether or not there is enough design margin to limit the possibility of false touch detection in a large volume production build. When conducting this testing, the test environment must be as close as possible to the expected use environment of the end product. This means that all possible noise aggressors that the capacitive touch sensor may be exposed to during operation of the product should be active during the measurement. For example, if a system has a motor, radio, or other internal or external noise source, measure SNR and check the design margins with those noise sources present and active.
NOTE
Version 1.80.00.00 or later of the CapTIvate Design Center contains the latest SNR and design margin analysis features.
NOTE
This procedure assumes that the user is reasonably familiar with the CapTIvate Design Center tool and CapTIvate Software Library. If that is not the case, review the getting started workshop before attempting to measure SNR.
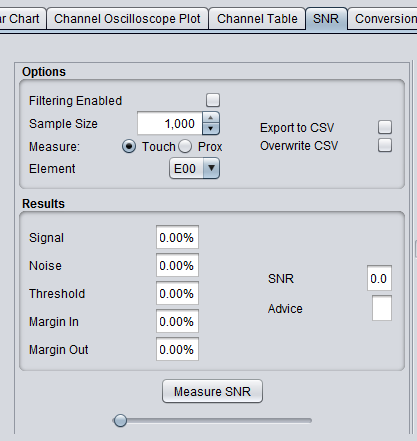
 Figure 1. SNR View Before Running Test
 - Use the CAPTIVATE-PGMR debug tool to connect your test hardware to a host computer running CapTIvate Design Center. Configure the target application and CapTIvate Design Center for UART or BULK_I2C communication. Connect the selected serial interface (UART or I2C) of the MCU under test to the CAPTIVATE-PGMR. See the CapTIvate Technology Guide for information on connecting signals to the CAPTIVATE-PGMR. In CapTIvate Design Center, open the Communications menu and select "Connect". If you can see sensor and element data in CapTIvate Design Center views, you have a working connection.
- With communication established, open the sensor customizer for the sensor that is to be tested by double-clicking the sensor customizer on the CapTIvate Design Center canvas and selecting the 'SNR' tab. A blank SNR screen appears (see Figure 1).
- Set up the desired filtering, sample size, threshold, element you want to test, and file options before running the test. Unless you want to analyze unfiltered data, enable filtering so that the SNR results are based on post-processed data as they would be in normal use. TI recommends a sample size of 1000 samples to obtain a statistically significant data set. The CSV logging options let you capture all of the tested samples for analysis in another tool if desired.
- With the desired options selected, select the "Measure SNR" button. A dialog asks you to touch the sensor being tested. At this time, the first Dataset is collected to determine the touch signal levels. After the touched data set is collected, the dialog box asks you to stop touching the button to measure the idle noise of the sensor.
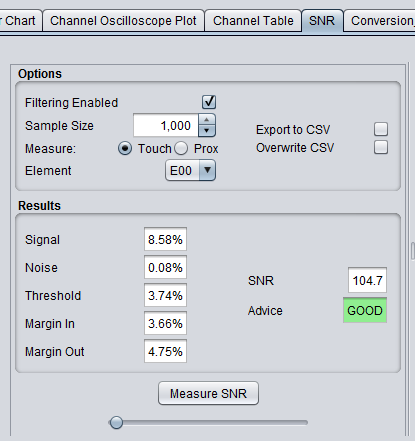
- After the touched and untouched data sets are collected, the tool computes the signal, noise, threshold, marginin, marginout, and SNR. It also provides advice about the robustness of the design.
Figure 3 shows an example SNR measurement of Button 1 on the CAPTIVATE-BSWP panel.
 Figure 3. SNR View After Running Test