SLUAAI0 January 2022 TPS62810-Q1 , TPS62811-Q1 , TPS62812-Q1 , TPS62813-Q1 , TPS62816-Q1 , TPS628501 , TPS628501-Q1 , TPS628502 , TPS628502-Q1 , TPS628503 , TPS628503-Q1 , TPS628510 , TPS628511 , TPS628512 , TPS62870 , TPS62870-Q1 , TPS62871 , TPS62871-Q1 , TPS62872 , TPS62872-Q1 , TPS62873 , TPS62873-Q1 , TPS62874-Q1 , TPS62875-Q1 , TPS62876-Q1 , TPS62877-Q1 , TPS62A01 , TPS62A01A , TPS62A02 , TPS62A02A , TPS62A06 , TPS62A06A , TPSM82810 , TPSM82813 , TPSM8287A06 , TPSM8287A10 , TPSM8287A12 , TPSM8287A15 , TPSM8287B30
3 Output Impedance Measurement of TPS62816
Figure 3-1 shows the output impedance measurement test setup. For more details regarding the impedance measurement method and different steps for a good calibration, refer to the How to Measure the Power Delivery Network Impedance of a DC-DC Converter.
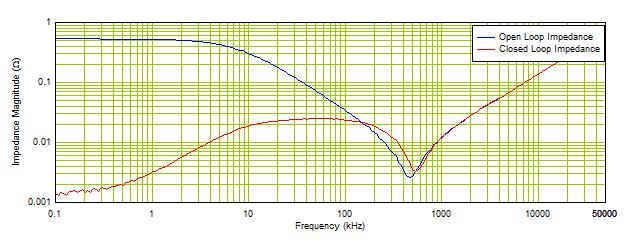
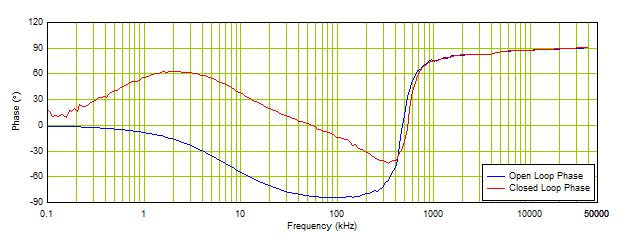
Figure 3-2 shows the output impedance comparison when the loop is open and when loop is closed with a 500mΩ resistive load connected to GND at the output. The respective Phases are plotted in Figure 3-3.
 Figure 3-2 Output Impedance Measurements Magnitude for TPS62816
 Figure 3-3 Output Impedance Measurements Magnitude for TPS62816
For the open loop impedance, at low frequencies the impedance curve is influenced by the constant output resistance of 500mΩ. Above 10 kHz, the measured impedance tracks the impedance of the output capacitor bank, flattening out with its ESR value at 500 kHz. The far right part of the curve is dominated by the inductive behavior of the capacitance at very high frequencies.
For the closed loop impedance, at low frequencies a high DC loop gain value can be observed which results in a low output impedance. At higher frequencies, the measured impedance curve shows a similar behavior as in an open loop condition.
A particular characteristics of loop gain stability is that for the frequencies of interests the closed loop impedance is higher than the open loop. This behavior is due to control loop stability and can be observed between 100 kHz and 500 kHz. This specific frequency range will help us determine by calculation the phase margin as well as the crossover frequency of the TPS62816.
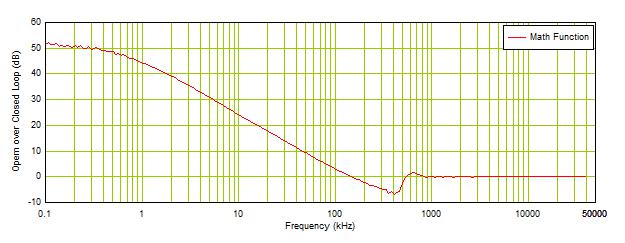
To facilitate further processing, a math function can be used to divide the open loop output impedance by the closed loop output impedance :
 Figure 3-4 Open Loop Impedance Divided by Closed Loop Impedance