SLVAE30E February 2021 – March 2021 TPS1H000-Q1 , TPS1H100-Q1 , TPS1H200A-Q1 , TPS1HA08-Q1 , TPS25200-Q1 , TPS27S100 , TPS2H000-Q1 , TPS2H160-Q1 , TPS2HB16-Q1 , TPS2HB35-Q1 , TPS2HB50-Q1 , TPS4H000-Q1 , TPS4H160-Q1
- Trademarks
- 1Introduction
- 2Driving Resistive Loads
- 3Driving Capacitive Loads
- 4Driving Inductive Loads
- 5Driving LED Loads
- 6Appendix
- 7References
- 8Revision History
4.5.4 Measurement Accuracy
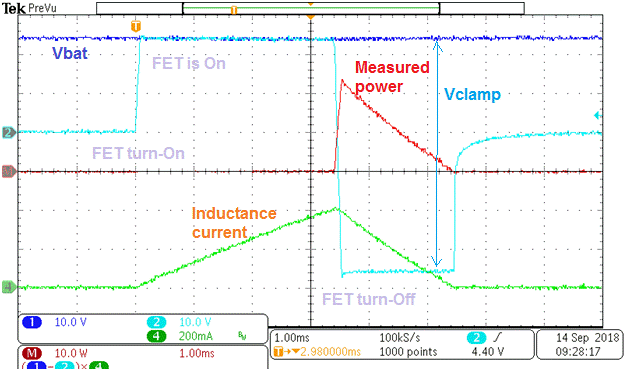
Let’s compare Equation 54 to measured data to verify the calculations. In this example, a pure inductor mounted on an iron core was measured precisely and a single 24-V pulse was applied and then turned off. The inductive coil had a 200 mH inductance and a 5.6 Ω series resistance.
 Figure 4-4 Demagnetization Energy During Inductive Turn-Off
Figure 4-4 shows both the turn-on and turn-off time. Looking at the turn-off time, we see that there is a TDEMAG of 3.3 ms and an I0 of 0.4 A. Table 4-1 compares these measured values to the values calculated from derived equations.
| Inductance | Peak Current | VSUPPLY | VCLAMP | Inductor Energy | Demagnetization Energy | Demagnetization Time | |
|---|---|---|---|---|---|---|---|
| 200 mH | 400 mA | 24 V | 60 V | 15.84 | Calculated | 26.4 mJ | 2.13 ms |
| Measured | 24 mJ | 2.05 ms |
Table 4-1 shows the calculated demagnetization energy from Equation 54 is 26.4 mJ and the measured value is 24 mJ, less than 10% difference. This small difference is due to the approximations made during the derivation and measurement tolerances. The derived equations offer a good approximation of the inductive discharge energy.