SNOAA76 August 2021 LDC3114 , LDC3114-Q1
4 Measured Raw Data Output
Characterizing sensor response before designing a metal proximity application helps optimize target detection for a set distance and desired resolution. The sensor response can be measured and compared to the predicted behavior calculated from the Inductive Sensing Calculator Tool.
The coils included with the LDC3114EVM have a diameter of 9 mm. For prototyping purposes, a distance of up to 9.11 mm was measured to capture the entire sensor response. With no target present, the calculated inductance of this sensor is 3.458 μH. The LDC3114EVM sensors have the following physical properties:
- Outer diameter: 9 mm
- Number of turns (per layer): 14
- Number of layers: 2
- Trace spacing: 5 mil
- Trace width: 5 mil
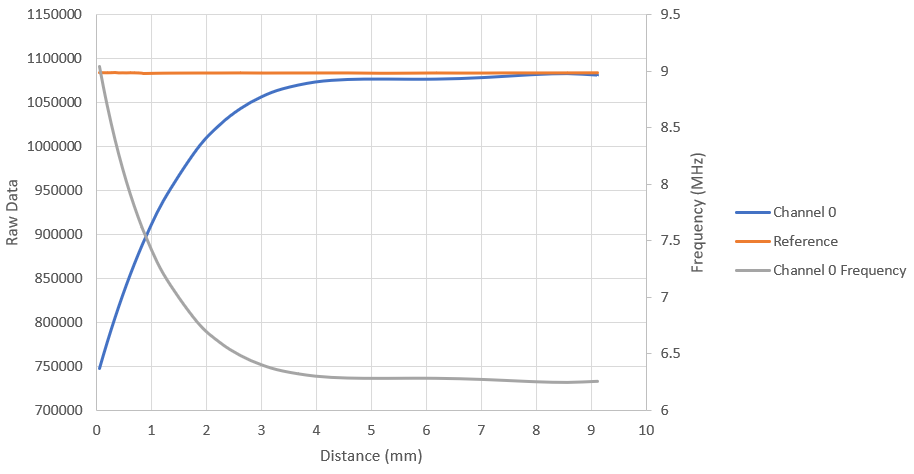
These coils were used with the LDC3114EVM to measure the raw data output as distance from the target increased. Figure 4-1 shows the response of the sensor coil connected to Channel 0 of the LDC3114EVM, as well as a reference coil that did not have interaction with the target. It is helpful to include a reference coil to be able to track the sensor response to a target, allowing the user to measure the point at which the target becomes undetectable.
 Figure 4-1 Measured Raw Data of LDC3114 With
LDC3114EVM Coil
Figure 4-1 Measured Raw Data of LDC3114 With
LDC3114EVM CoilThe average raw data output of the Channel 0 sensor approaches the output of the reference coil as distance increases. Within 1.8 mm of the target the sensor response is seen to be the strongest, and this correlates with 20% of the sensor diameter.
The frequency is calculated from the measured raw data as illustrated in Figure 4-1. Equation 1 shows the relationship between the raw data and sensor frequency.
where:
- fREF_CLK is the internal reference clock frequency of 44 MHz
- W can be calculated from Equation 1
See the LDC3114-Q1 4-Channel Hybrid Inductive Touch and Inductance to Digital Converter data sheet and register maps for more detailed information on using these equations.