SWRU439M October 2015 – April 2022
- Trademarks
- 1Introduction
- 2Overview
- 3Prerequisites
- 4Installation
- 5Sensor Controller Studio Tutorials
-
6Sensor Controller Studio Walkthrough
- 6.1 Start Page and Navigation
- 6.2 Documentation
- 6.3 Open the Example
- 6.4 Project Panel
- 6.5 Task Panel Settings
- 6.6 Constants and Data Structures Panel
- 6.7 Task Code Editor Panels
- 6.8 I/O Mapping Panel
- 6.9 Code Generator Panel
- 6.10 Compiling Example Applications in IAR or CCS
- 6.11 Task Testing Panel
- 6.12 Run-Time Logging Panel
- 7References
- 8Revision History
6.12.2 Run-Time Logging Session
Ensure that the correct target chip is selected in the project panel, then connect to the target.
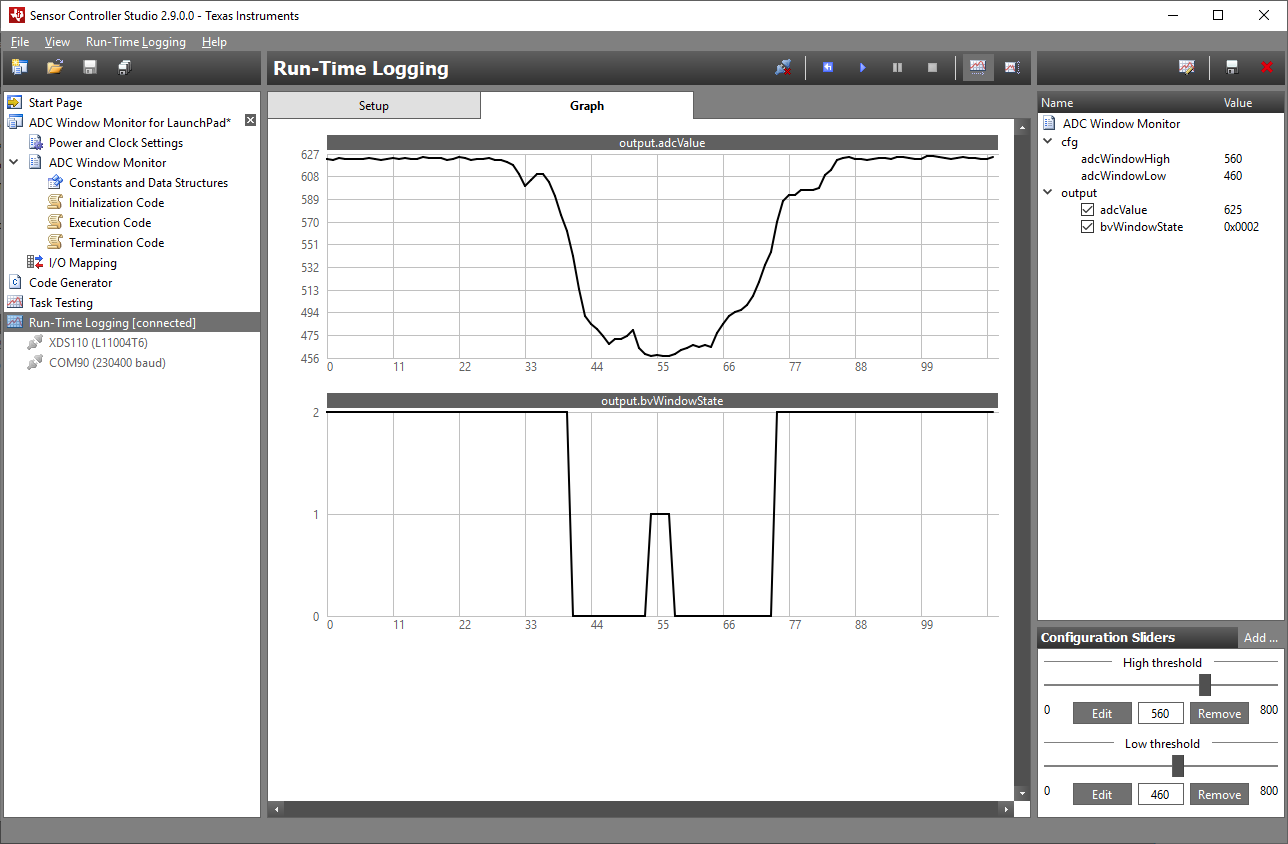
When connected, the panel switches to the Graph tab, as shown in Figure 6-14.
 Figure 6-14 Run-Time Logging Graph
Tab
Figure 6-14 Run-Time Logging Graph
TabIn the right section of the panel, select the logged data structure members to be displayed in the Graph tab. There is one graph section for each data structure member because value ranges typically vary. Use graph customization to merge different data structure members into one graph section with scaling and offset.
Editable data structure members can be modified at any time. The cfg data structure members can also be controlled by configuration sliders.
For run-time logging, it is only possible to run the Sensor Controller tasks at full speed.
Use the Ctrl and Shift keys in combination with the mouse wheel to zoom and scroll the graph area.