SLAU869E October 2022 – January 2024
- 1
- Abstract
- Trademarks
- 1Getting Started
-
2Hardware
- 2.1 Jumper Map
- 2.2 Block Diagram
- 2.3
Hardware Features
- 2.3.1 MSPM0L1306 MCU
- 2.3.2 XDS110-ET Onboard Debug Probe With EnergyTrace Technology
- 2.3.3 Debug Probe Connection: Isolation Jumper Block
- 2.3.4 Application (or Backchannel) UART
- 2.3.5 Using an External Debug Probe Instead of the Onboard XDS110-ET
- 2.3.6 Using the XDS110-ET Debug Probe With a Different Target
- 2.3.7 Special Features
- 2.4 Power
- 2.5 External Power Supply and BoosterPack Plug-in Module
- 2.6 Measure Current Draw of the MSPM0 MCU
- 2.7 Clocking
- 2.8 BoosterPack Plug-in Module Pinout
- 3Software Examples
- 4Resources
- 5Schematics
- 6Revision History
1.4.2 Running the Out-of-Box Experience
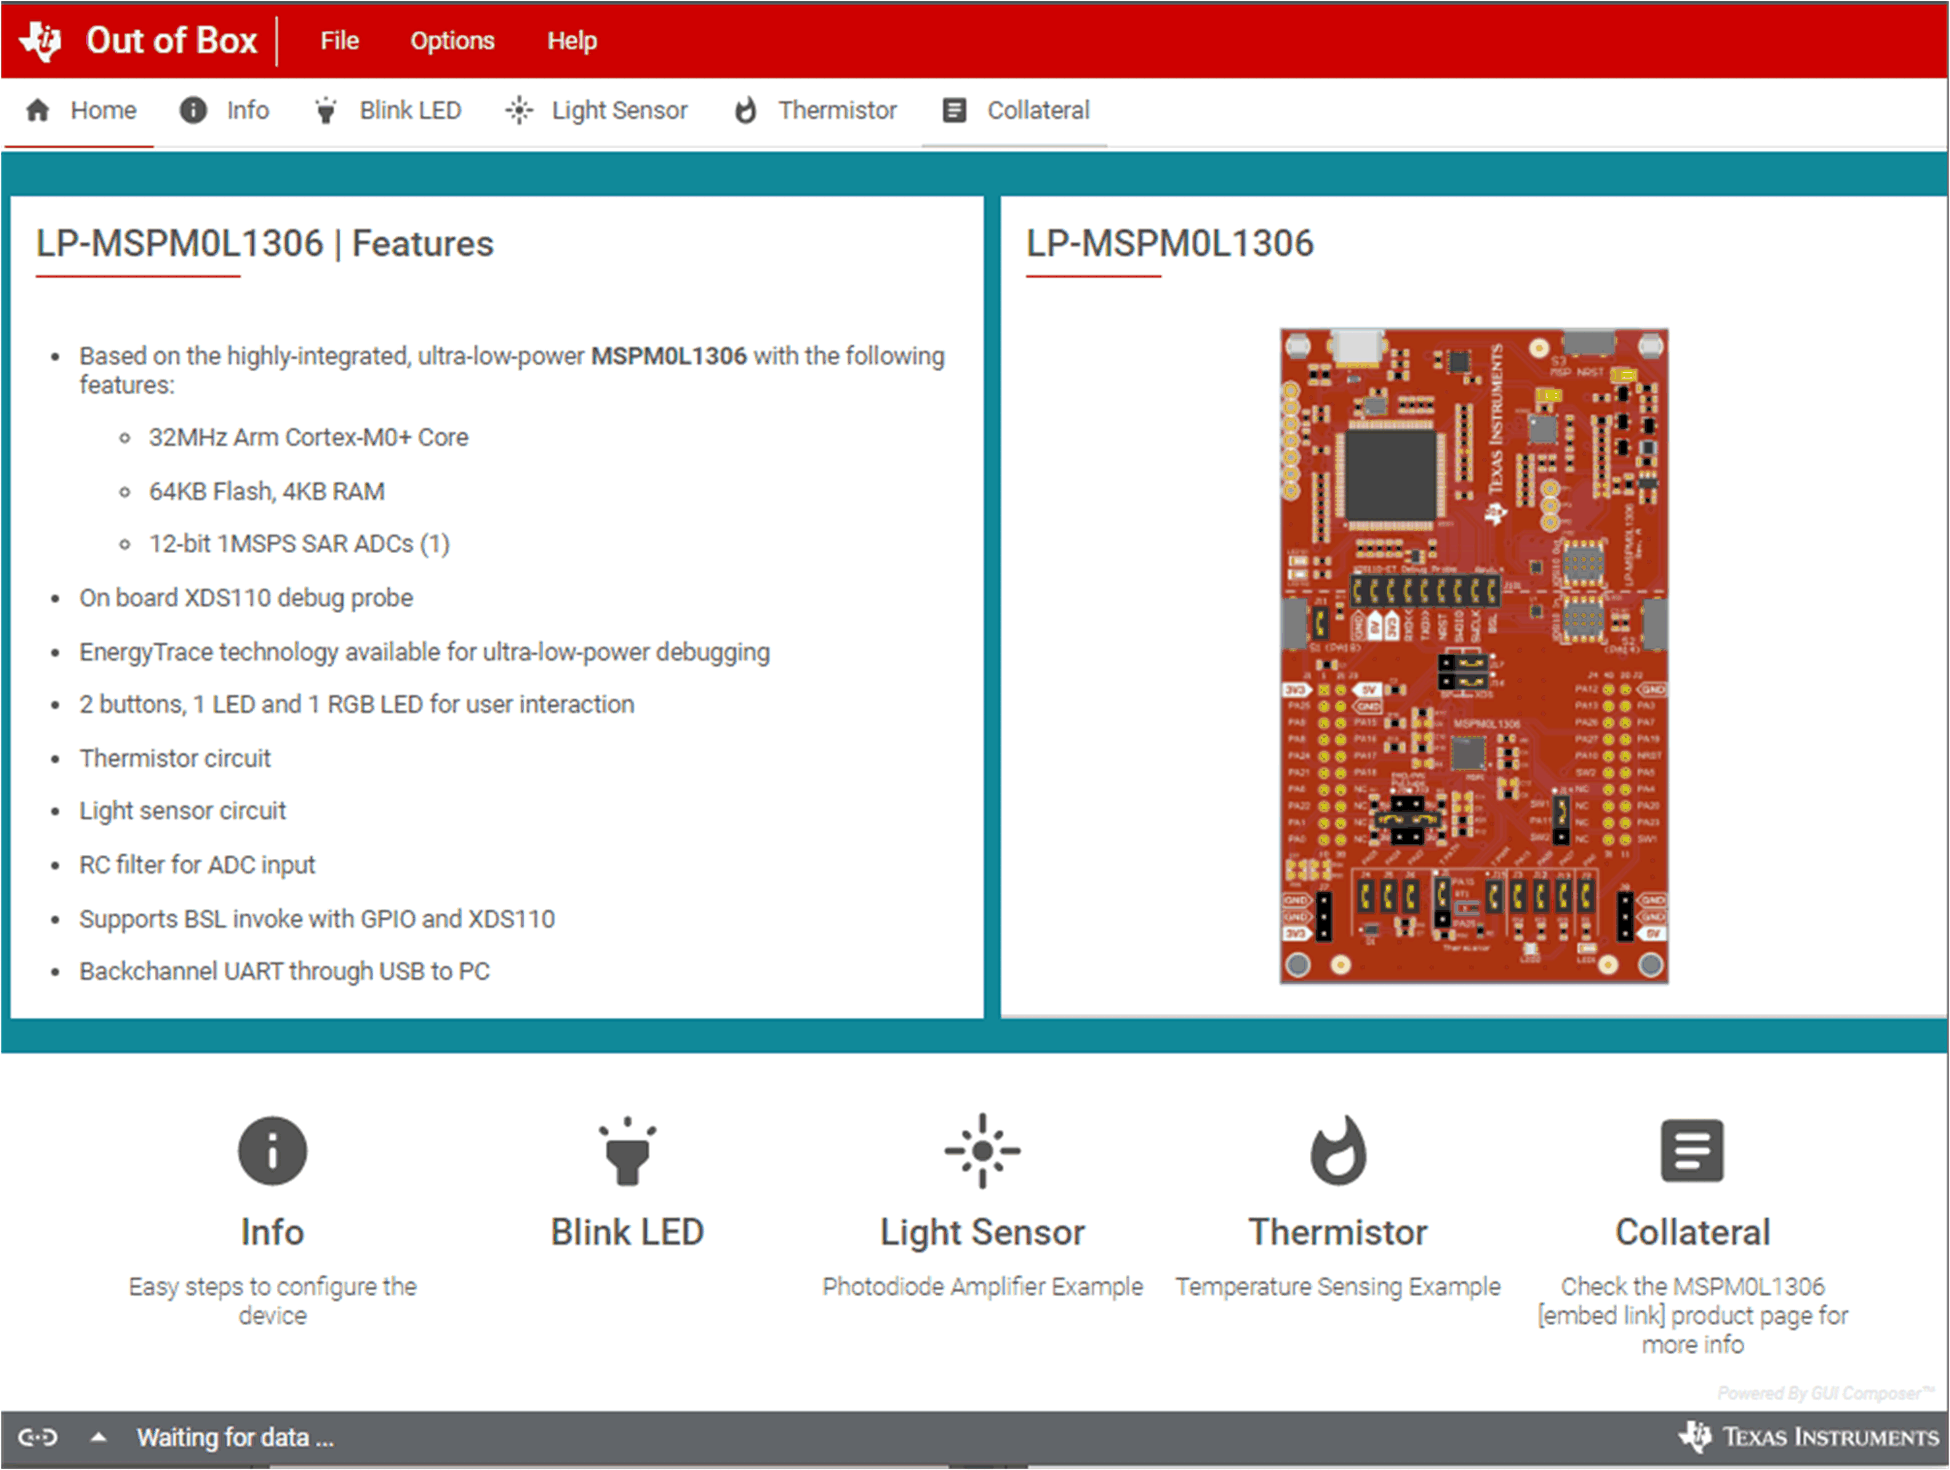
Access the GUI Composer powered GUI for the Out-of-Box Experience (OoBE) through the TI Cloud Gallery. Alternatively, the GUI is provided with the MSPM0 SDK as well for offline operation. Figure X below shows the welcome screen for the GUI. The GUI runs through three main examples:
- Blink LED – Change rate of LED blink
- Light Sensor – Read light sensor and plot results, while also modulate RGB brightness
- Thermistor – Read thermistor voltage and plot converted temperature over time. RGB LED changes colors to signify differences of temperature measured.
 Figure 1-1 LP-MSPM0L1306 OoBE GUI