SLUUCN1C June 2022 – December 2022 UCC28C50 , UCC28C50-Q1 , UCC28C51 , UCC28C51-Q1 , UCC28C52 , UCC28C52-Q1 , UCC28C53 , UCC28C53-Q1 , UCC28C54 , UCC28C54-Q1 , UCC28C55 , UCC28C55-Q1 , UCC28C56H , UCC28C56H-Q1 , UCC28C56L , UCC28C56L-Q1 , UCC28C57H , UCC28C57H-Q1 , UCC28C57L , UCC28C57L-Q1 , UCC28C58 , UCC28C58-Q1 , UCC28C59 , UCC28C59-Q1
- Trademarks
- 1General Texas Instruments High Voltage Evaluation (TI HV EVM) User Safety Guidelines
- 2Description
- 3Schematic Diagram
- 4EVM Setup and Operation
-
5Performance Data
- 5.1 Efficiency Versus Load, 10% to 100% Load
- 5.2 Efficiency Versus VIN at 100% Load
- 5.3 Power Loss Versus Load, 10% to 100% Load
- 5.4 Load Regulation, 10% to 100% Load
- 5.5 Light Load Regulation, 0-mA to 200-mA Load
- 5.6 Line Regulation, Various Loads
- 5.7 Startup Waveforms
- 5.8 Shutdown Waveforms
- 5.9 Output Voltage Ripple
- 5.10 Steady State Switching Waveforms
- 5.11 Transient Load Waveforms
- 5.12 Over Current and Short Circuit Protections
- 5.13 Stability Measurements
- 5.14 Thermal Measurements
- 6Assembly and Printed Circuit Board (PCB)
- 7Bill of Materials (BOM)
- 8Revision History
5.14 Thermal Measurements
Test Methodology:
As shown in figure 5-35, the UCC28C56H EVM was placed in a protective enclosure to isolate the high-voltage (VIN > 50V) from test personnel. The enclosure did not provide any forced air movement (i.e. there are no fans). The following thermal results should be considered worst-case due to the dead-air environment. For each load condition, the soak time was 30 – 45 minutes.
The hottest component on the EVM is the transformer. The transformer temperature was taken two ways: (1) by a thermocouple taped directly to the top of the windings (see figure 5-36), and (2) using a thermal camera and black electrical tape placed directly over the thermocouple/windings (see figure 5-37). The two methods provided results within 2 °C of each other. Temperature of the output rectifier diode and switching MOSFET were taken only with the thermal camera. The PCB temperature near the transformer was measured with a thermocouple.
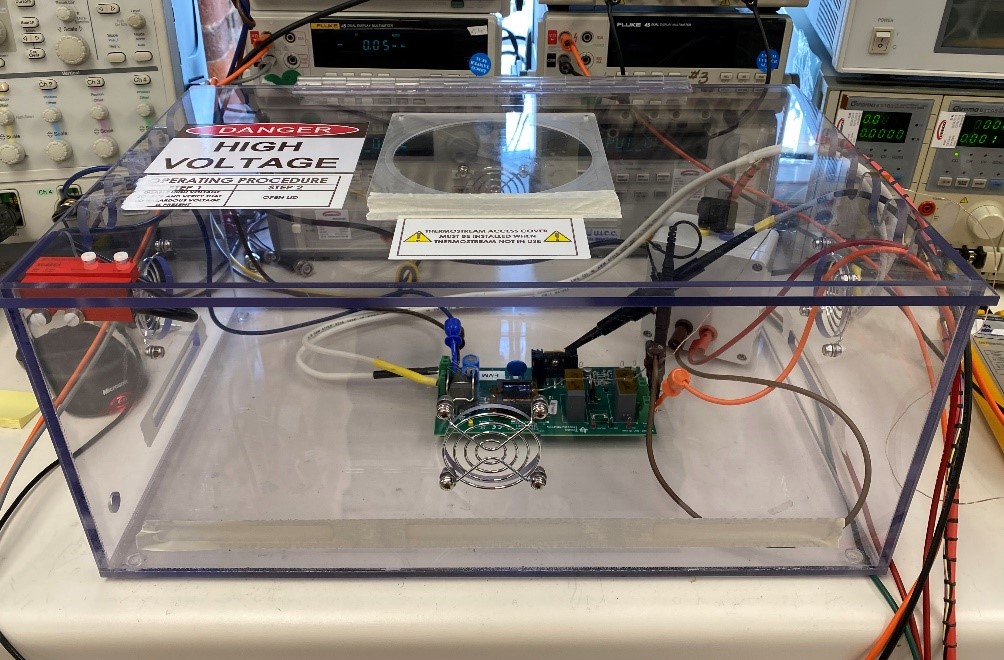 Figure 5-35 UCC28C56H
EVM in plexiglass enclosure for HV safety. Virtually no
airflow.
 |
|
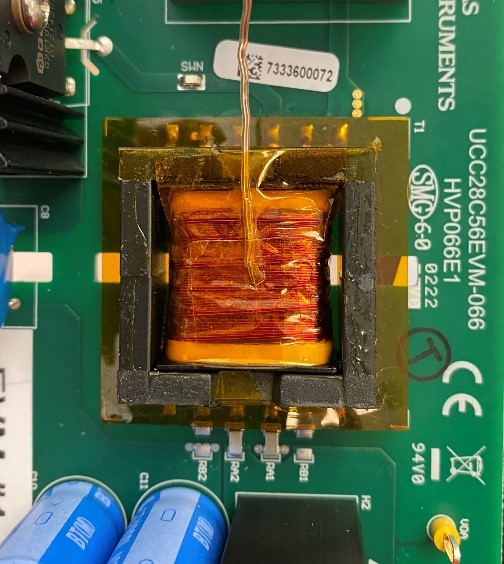 Figure 5-36 Thermocouple taped to windings
 |
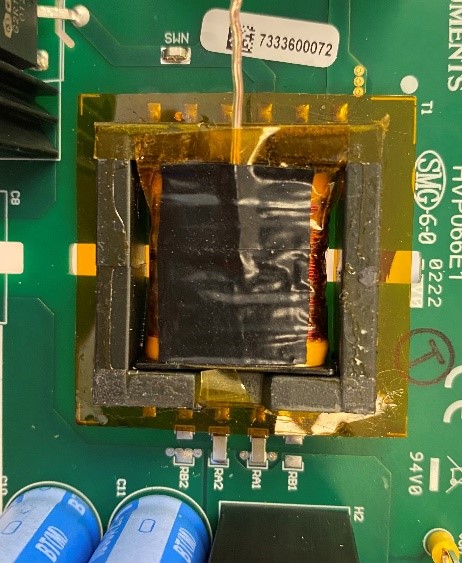 Figure 5-37 Black tape
for thermal camera
 |
Transformer Temperature vs Load
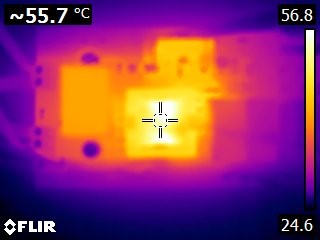 Figure 5-39 Transformer temperature is 55.7°C
 |
Transformer & PCB Temperatures:
Transformer TRISE = 53.9 °C - 30.6 °C = 23.3 °C |
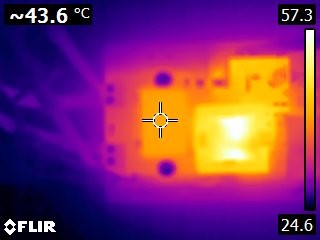 Figure 5-40 Output
diode temperature is 43.6°C
 |
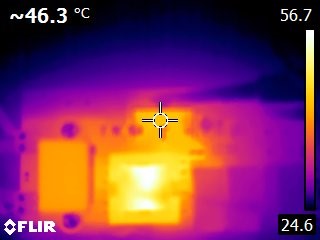 Figure 5-41 MOSFET
temperature is 46.3°C
 |
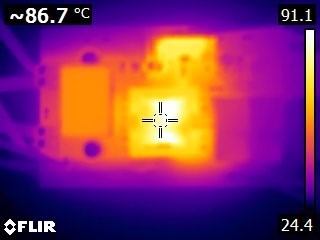 Figure 5-42 Transformer temperature is 86.7°C
 |
Transformer & PCB Temperatures:
Transformer TRISE = 86.5 °C - 37.6°C = 48.9 °C |
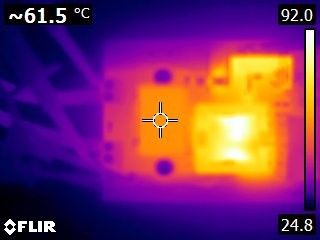 Figure 5-43 Output
diode temperature is 61.5°C
 |
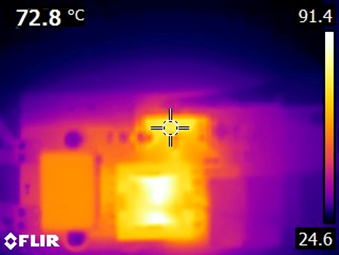 Figure 5-44 MOSFET
temperature is 72.8°C
 |