SSZTA61 may 2017 TPS548B22
Converter stability is a primary requirement for any synchronous buck converter design. Confirming converter stability requires that you derive the small-signal transfer function and measure the Bode plot of a closed-loop system. It is possible to derive the small-signal transfer function rigorously using complicated mathematic equations; the results can be very insightful in terms of understanding the nature of the stability requirement. However, deriving the small-signal transfer function is outside of the scope of this post.
In the absence of theoretical analysis, you can use a network analyzer to measure the Bode plot and confirm the stability of your converter design. If done properly, the Bode plot result can be a very useful, quick way to help you gauge converter stability.
The D-CAP™ topology is gaining in popularity due to its ease of use. D-CAP stands for “directly across the output capacitor.” TI introduced a family of D-CAPTM switch mode power supplies that incorporates either the external RCC network (RRAMP, CRAMP1 and CRAMP2) or an internal ripple-injection circuit such as D-CAP3, making it easier to design with all-ceramic-output capacitor configurations (Figure 1). In this post, I will compare the D-CAP3™ Bode plot measurement results based on different setup methods, including ripple injection magnitude and small-signal injection magnitude. In order to obtain a reliable and meaningful Bode plot result, you’ll have to follow a few preliminary steps.
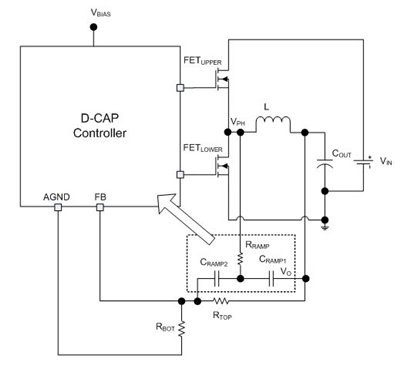 Figure 1 D-CAP IC with RCC Network Synchronous Buck Converter
Figure 2 shows two setup methods of network analyzer equipment: the VO pin at the input (VA in Figure 2a) and output (VB in Figure 2b) of the AC injection. This VO pin is the same signal as the VO of the RCC network in Figure 1. From the Bode plot phase margin test theorem, the crossover frequency is defined when the frequency of the converter loop gain is at 0dB or unity. At this crossover frequency, the phase margin of the converter loop gain must be positive, and at least higher than 45 degrees in order to reduce output voltage ringing during the load transient step.
The results in Figure 3 show the minimum difference between the two setup methods. However, by using the results from Figure 2a, you can confirm the resonant frequency location of the inductor and output capacitor values of the converter. The results are from the TPS548B22 evaluation board with VIN =12V, VOUT =1V, FSW = 650kHz, L = 330nH, COUT = 2 x 470µF + 7 x 100µF and ILOAD = 10A resistive load.
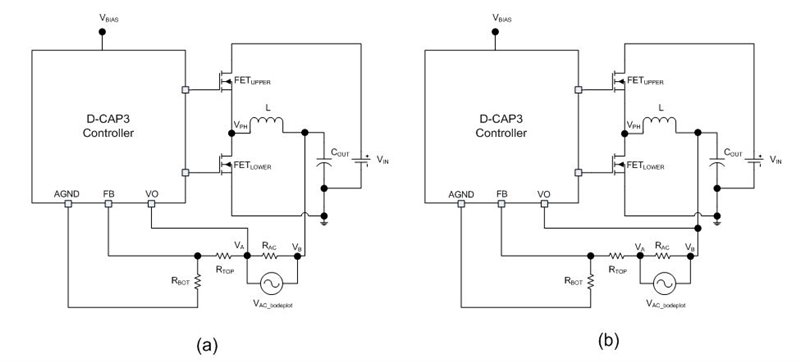 Figure 2 Bode Plot Setup of VO Pin at
VA (a) and at VB (b) on TPS548B22 Evaluation Module
EVM
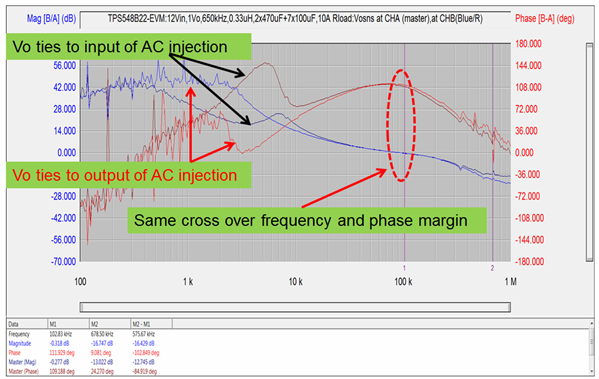 Figure 3 Bode Plot Results from the
Setup Shown in Figure 2
Figure 3 Bode Plot Results from the
Setup Shown in Figure 2You might ask how the magnitude of the RCC network affects the Bode plot result. Due to the noise sensitivity of this topology, the controller requires a minimum ramp magnitude to ensure that the converter operates correctly in steady state while providing the best load-transient response. Figure 4 shows the comparison results between a 6mV and 12mV ramp magnitude of the RCC network. The crossover frequency of the 12mV ramp is around 29kHz, with a 95-degree phase margin. The crossover frequency of the 6mV ramp is about 102kHz, with a 117-degree phase margin.
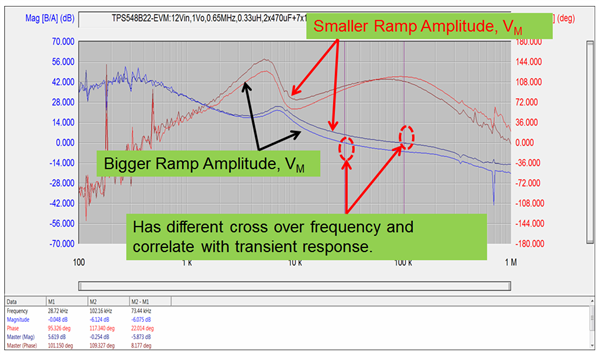 Figure 4 Bode Plot Comparison with Different Ramp Values on the TPS548B22 EVM
As you can see from Figure 4, the RCC ramp magnitude affects the crossover frequency and phase margin.
Another question that you may have when taking Bode plot measurements in D-CAP 3 control mode is what the AC injection magnitude range needs to be when measuring – and it must be a range that won’t affect the converter loop-gain result. Figure 5 shows the comparison results with a 2.5mV and 10mV AC injection signal. A good recommendation value is to keep this AC injection magnitude to 10mV or less.
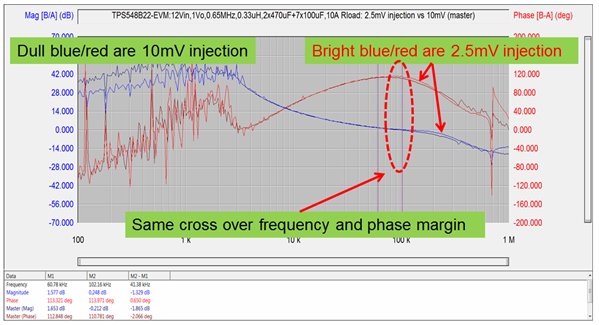 Figure 5 Bode Plot Comparison with Different AC Injection Magnitude
To obtain a good Bode plot result, it is critical that you pay attention to the setup and take some precautionary steps to reduce errors in the measurement. Some basic recommendations are:
- Before taking the measurement, calibrate the network analyzer or do a 0dB measurement to ensure flat gain and zero phase across the frequency range of interest.
- Use the analog ground of the controller as the reference for the Bode plot probes. See the example comparison in Figure 6.
- Keep the probes far away from the inductor in order to avoid coupling the inductor magnetic-field signal onto the AC injection magnitude.
- If possible, use the resistive power dissipation at the load connection instead of the electronic current source mode.
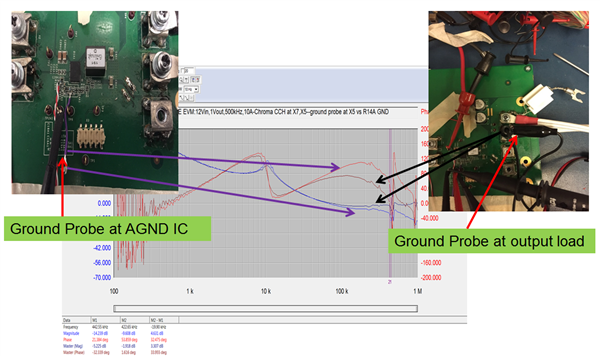 Figure 6 Bode Plot Comparison on
Customer Board with Different Ground Probe Connection Location
Figure 6 Bode Plot Comparison on
Customer Board with Different Ground Probe Connection LocationA Bode plot measurement result enables you to quickly gauge converter stability rather than deriving the converter’s small-signal transfer function. The phase margin test theorem gives the same results whether the VO pin is at the input or output location of the AC injection in D-CAP3 control mode setups. To obtain a trustworthy Bode plot result that gives you confidence about your system, take some precautionary setup steps to minimize errors. Read the blog posts “D-CAP3 – A sequel better than the original” and “Design advantage of D-CAP control topology” for more information on TI’s D-CAP control architecture.