SSZTC20 october 2015 DLP2010NIR
As engineers and developers, our jobs are to figure out the best way to put stuff together. From skyscrapers to integrated circuits, if it works well it’s because it’s engineered well. But who among us doesn’t daydream of taking things apart? Most of our first engineering memories are from when we were kids deconstructing something that looked complicated (not to mention expensive).
With that in mind, we wanted to take a look inside the DLP NIRscan Nano Evaluation Module (EVM), and we’re doing it the old fashioned way – by pulling it apart.
Please note that any disassembly of the optical engine voids the warranty on the NIRscan Nano EVM system and removing the cover on the optical engine allows dust and smudges to collect on the optics affecting its performance. Also, removing the cover might move the optics, slit, and detector out of alignment requiring factory realignment and recalibration. Removing the slit, Indium Gallium Arsenide (InGaAs) detector and DLP2010NIR will require the system to be realigned and recalibrated at the factory.
In short, do not try this at home.
Let’s begin with a quick overview. DLP spectrometers replace the traditional linear array detector with a digital micromirror device (DMD) for wavelength selection and a single point detector. By sequentially turning on a set of columns pertaining to a particular wavelength of light, the light is directed to the detector and captured. By scanning through a set of columns across the DMD, an absorption spectrum can be computed.
DLP technology in Near-Infrared (NIR) spectroscopy provides the following advantages:
- Higher performance through the use of a larger single point 1-mm detector in comparison to a linear array with very small pixels.
- Lower cost system through the use of single element detectors and low cost optics. The high resolution DMD allows custom patterns to compensate for the optical distortion of each individual system.
- Greater signal captured not only because of the larger entendue of the DMD compared to traditional technologies, but also through the use of fast, flexible, and programmable patterns and spectral filters.
- With programmable patterns, a DLP
spectrometer can:
- Vary the intensity of light to the detector by controlling the number of pixels in a column.
- Vary the resolution of the system by controlling the width of the columns.
- Use a set of Hadamard patterns that capture multiple wavelengths of light per pattern. Individual wavelengths are then retrieved through a decoding procedure. Each pattern turns on 50 percent of the DMD pixel at a time, directing much greater signal into the detector than the column scan shown above.
- Use custom spectral filters to select specific wavelengths of interest.
Currently, DLP NIRscan Nano EVM software supports variable resolution and Hadamard patterns. Variable intensity and custom spectral filters are not supported.
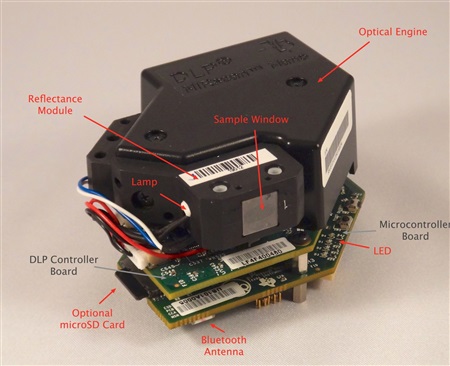
In this picture, you can see the major components of the DLP® NIRscan™ Nano EVM:
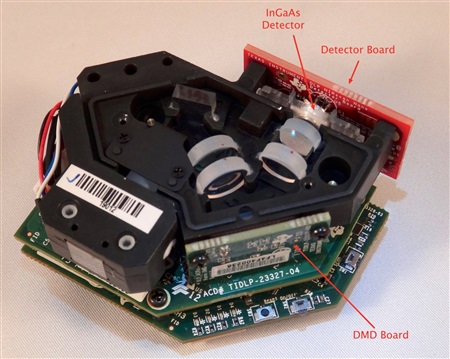
Removing the cover to the optical engine reveals the DMD and Detector board:
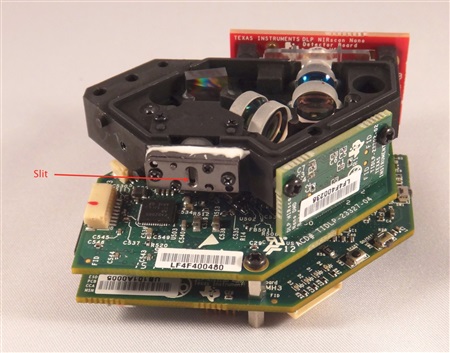
Now if we removed the Reflectance module, you can see the slit:
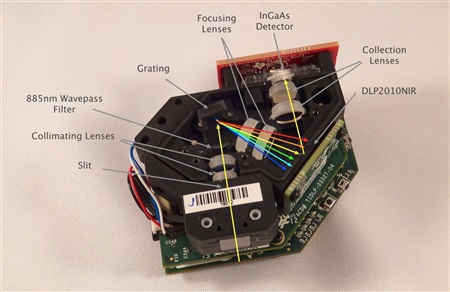
Now that we’ve gotten inside, let’s take a look at how the light is manipulated.
The light reflected from the sample is gathered by the Collection lens and focused into the optical engine through the input slit. The slit size is chosen to balance wavelength resolution with signal-to-noise ratio (SNR) of the spectrometer. This spectrometer uses a 25 μm wide by 1.69 mm tall slit. The light that passes through the slit is collimated by the first set of lenses, passes through an 885-nm long wavepass filter, and then strikes a reflective grating. This grating, in combination with the focusing lens, disperses the light into its constituent wavelengths (multi-colored light rays). The focusing lenses form an image of the slit at the DLP2010NIR DMD. Different wavelengths of this slit image are spread horizontally across the DLP2010NIR DMD. The optical system images 900 nm wavelengths to one end of the DMD and 1700 nm to the other end, with all other wavelengths sequentially dispersed in between.
Thanks for giving us an excuse to take something apart. For more information on DLP NIRscan Nano EVM, refer to the DLP NIRscan Nano User’s Guide.