SWRA662A January 2020 – September 2022 AWR1243 , AWR1443 , AWR1642 , AWR1843 , AWR1843AOP , AWR2243 , AWR6843 , AWR6843AOP , IWR1443 , IWR1642 , IWR1843 , IWR6443 , IWR6843 , IWR6843AOP
4.1 Localization
Localization can be accomplished in one of two ways.
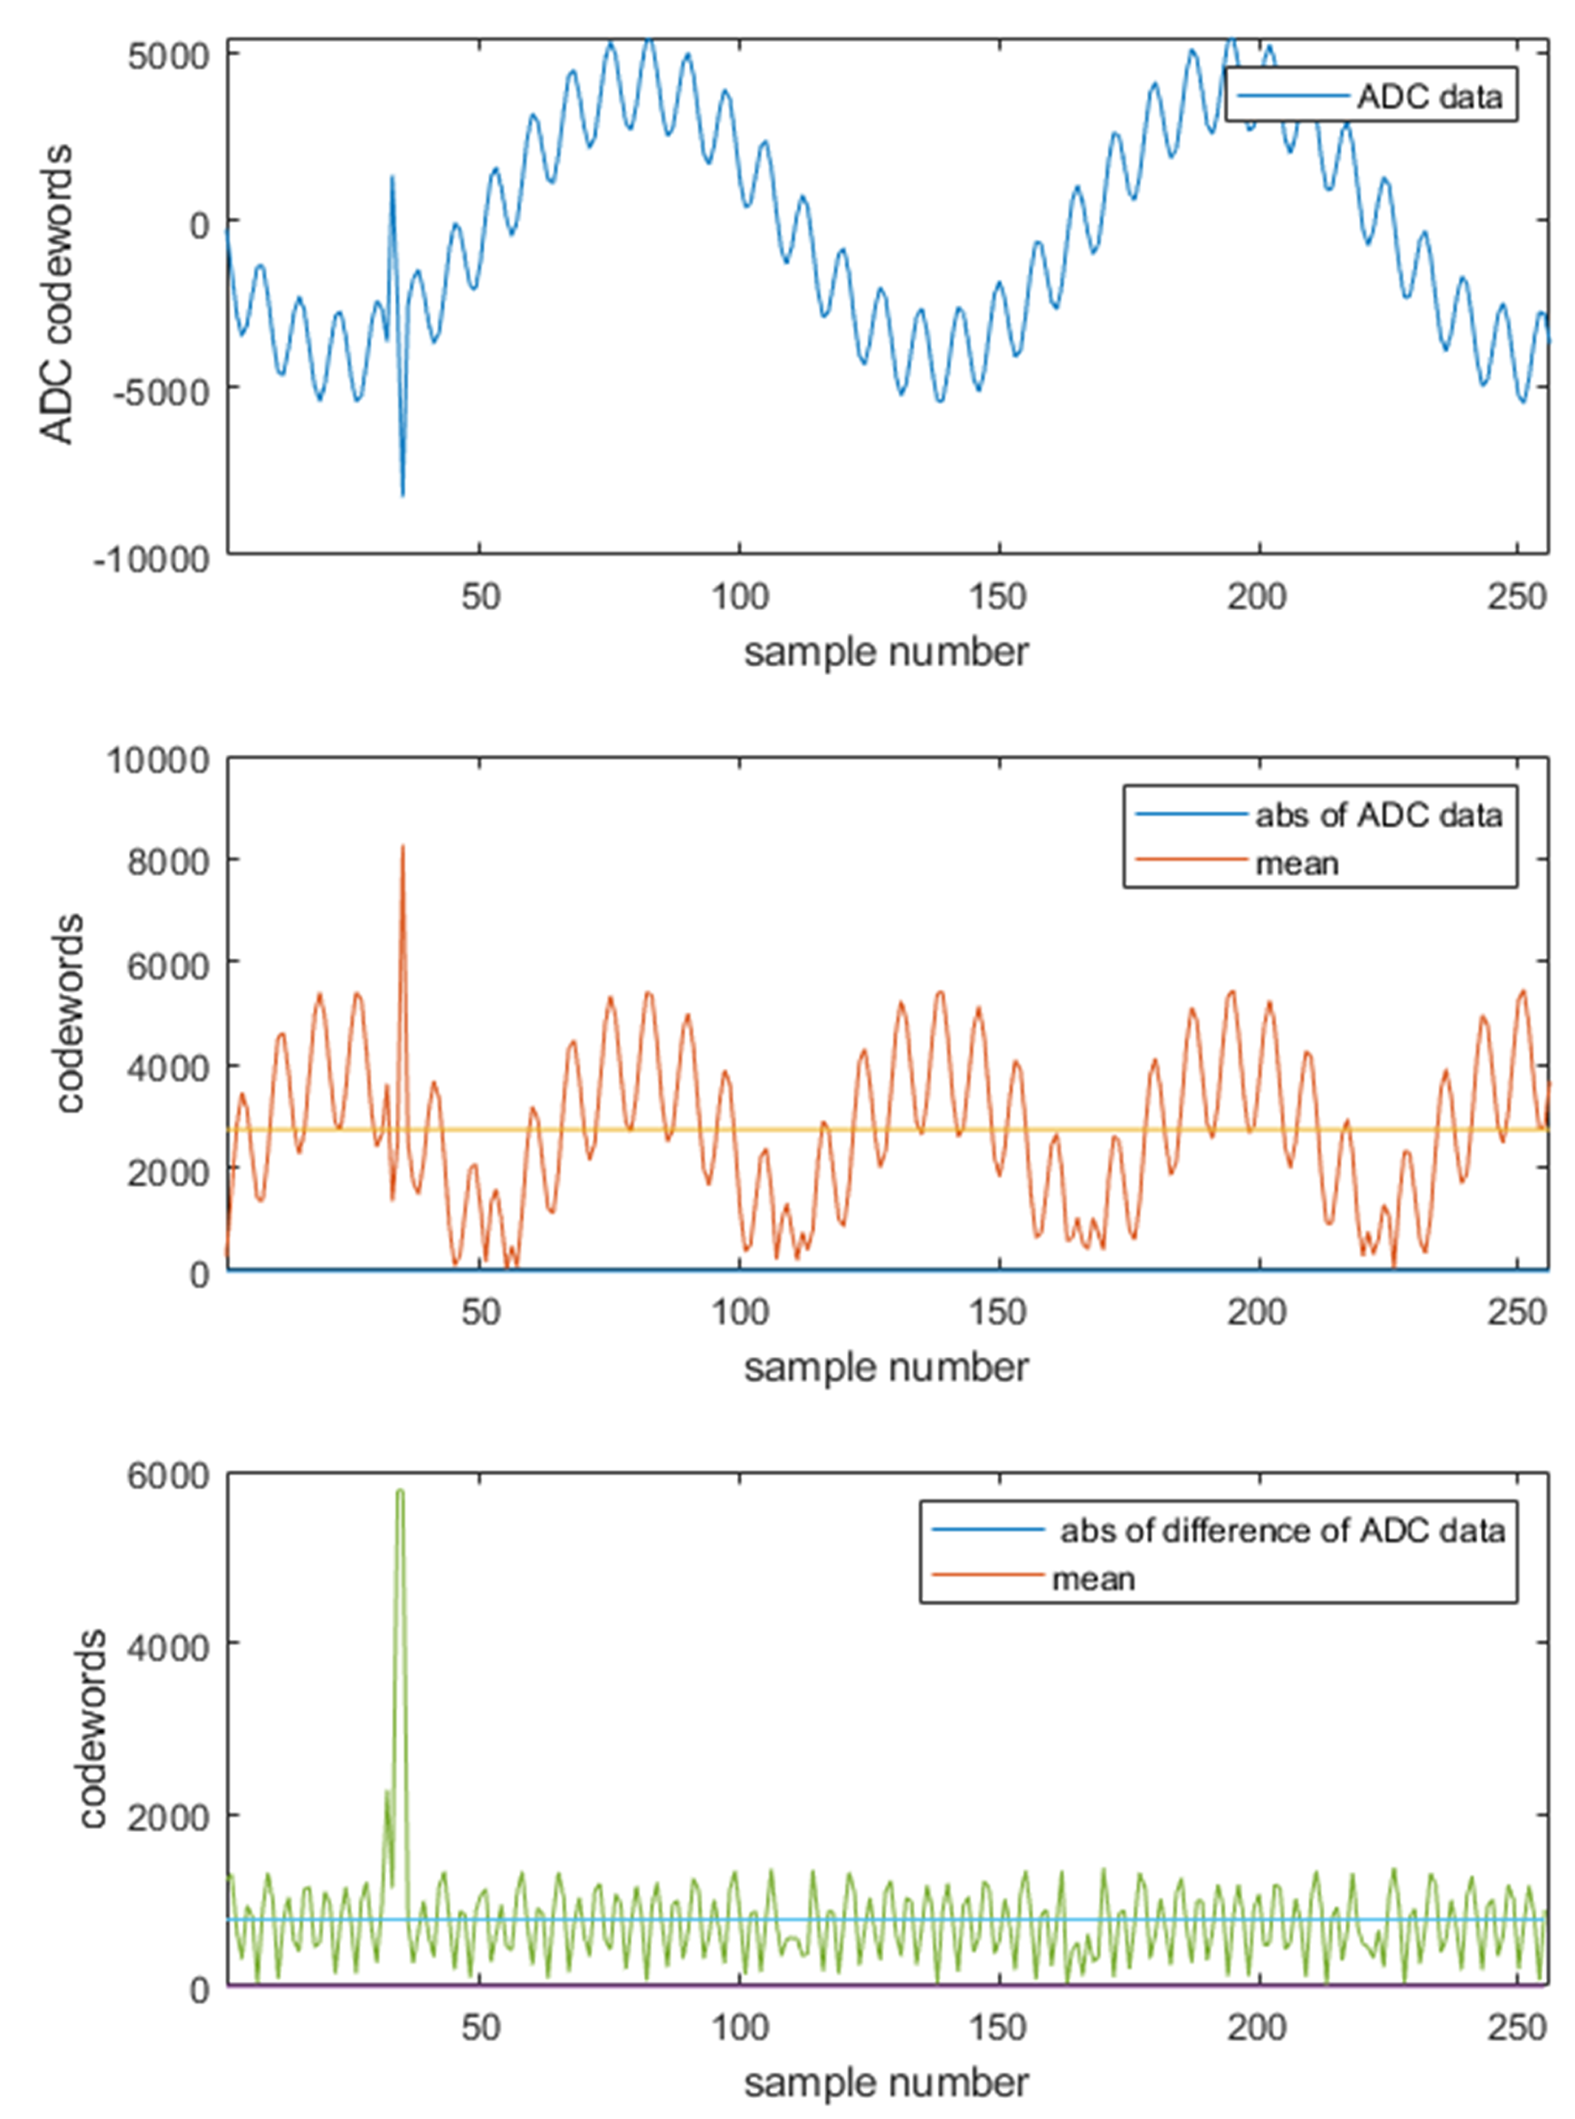
- First, find outliers in ADC data. Strong crossing interferers look like large glitches in ADC data. For example, if you were to take the energy of each sample in a chirp and plot it as a function of time, at the point where the interferer crosses, there is a large increase in the first sample energy of the chirp. A suitable threshold can be found and set, and samples that cross this threshold in energy can be marked as having been affected by interference. Figure 4-1 shows a sample ADC data (top) – When it its absolute value is plotted the glitch is clearly visible (middle), though not very distinct from the signal due to the large low frequency signals present. However, if these low frequency signals are suppressed using a simple difference filter, the resulting signal lets the glitch stand out even more.
 Figure 4-1 Detecting Outliers Using abs and abs-diff Filters
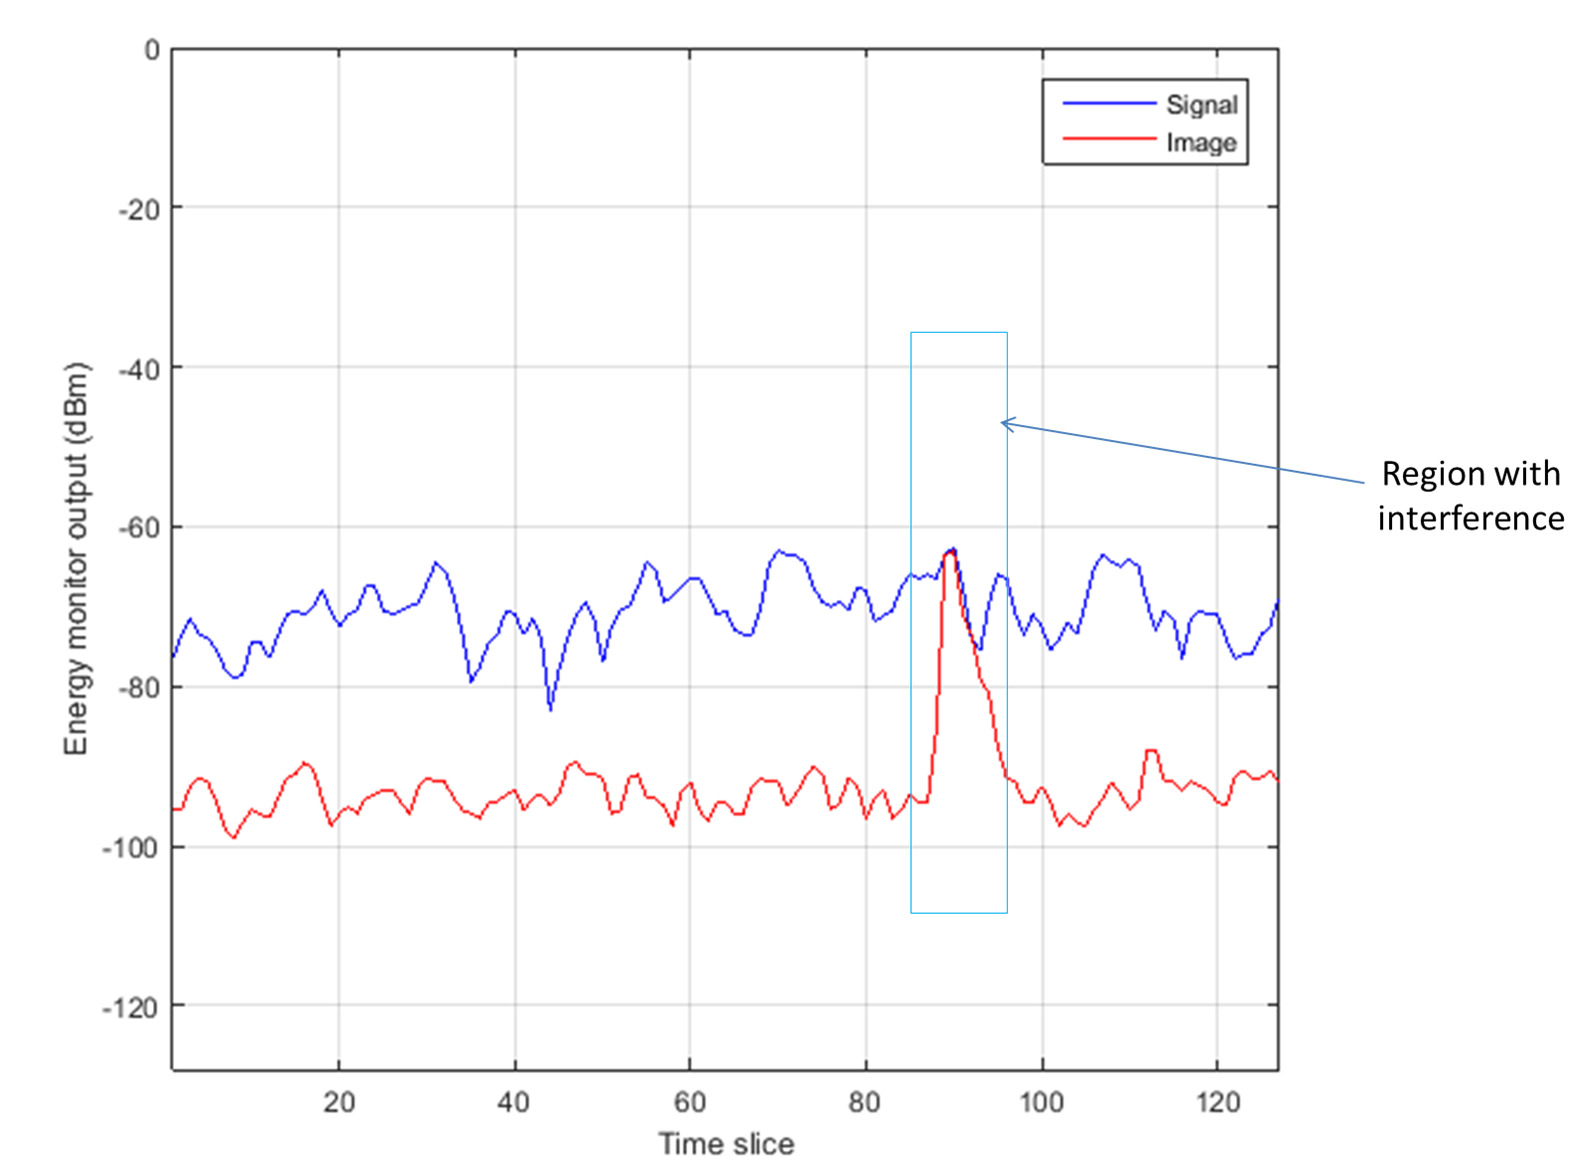
 - Chirp quality metrics are additional metrics that are optionally attached to each chirp, and use some of the advanced features of the XWR devices to provide information about interference. The interference detection training video provide details to enable chirp quality metrics. As XWR devices have complex base-bands, they can discriminate between positive frequencies and negative frequencies. As stated in Section 2.3.1, delays can never be negative. Thus, if the slope is positive, all valid objects have positive frequencies (that is, they exist in the signal band). Any signal in the negative frequency (image band) is likely to be due to interference. The signal and image band monitor monitors these two bands separately. As can be seen in Figure 4-2, the signal band (blue line) is stronger than the image band (red line). However, when crossing interference appears, the image band has an sudden rise in energy. This indicator is used to locate weak interferers.
 Figure 4-2 Using the Signal and Image Band Monitor to Locate Interferers