SBAU269C October   2016  – August 2021 ADS8900B


  1.   Trademarks
  2. 1EVM Overview
    1. 1.1 ADS8900EVM-PDK Kit Features
    2. 1.2 ADS8900EVM Features
  3. 2Analog Interface
    1. 2.1 ADS8900B Connections and Decoupling
    2. 2.2 ADC Amplifier Input Drive
    3. 2.3 Voltage Reference and VCM Scaling
  4. 3Digital Interface
    1. 3.1 multiSPI™ for ADC Digital I/O
    2. 3.2 I2C Bus for Onboard EEPROM
  5. 4Power Supplies
    1. 4.1 Positive Supply and Test Points
    2. 4.2 Negative Supply
  6. 5ADS8900EVM-PDK Initial Setup
    1. 5.1 Software Installation
    2. 5.2 Default Jumper Settings for Differential Inputs
    3. 5.3 Default Jumpers for Bipolar, Single-Ended Inputs
    4. 5.4 Default Jumpers for Unipolar, Single-Ended Inputs
    5. 5.5 External Source Requirements for ADS8900 Evaluation
  7. 6ADS8900EVM-PDK Operation
    1. 6.1 EVM GUI Global Settings for ADC Control
    2. 6.2 Register Map Configuration Tool
    3. 6.3 Time Domain Display Tool
    4. 6.4 Spectral Analysis Tool
    5. 6.5 Histogram Tool
    6. 6.6 Linearity Analysis Tool
    7. 6.7 ADS8900BEVM Support for ADS8910B and ADS8920B Devices
  8. 7Bill of Materials, PCB Layout, and Schematics
    1. 7.1 Bill of Materials (BOM)
    2. 7.2 PCB Layout
    3. 7.3 Schematics
  9. 8Revision History

Spectral Analysis Tool

The spectral analysis tool, shown in Figure 6-6, is intended to evaluate the dynamic performance (SNR, THD, SFDR, SINAD, and ENOB) of the ADS8900B SAR ADC through single-tone sinusoidal signal FFT analysis using the 7-term Blackman-Harris window setting. Also, the window setting of None can be used to look for noise spurs over frequency in DC inputs.

For dynamic performance evaluation, the external differential source must have better specifications than the ADC itself to ensure that the measured system performance is not limited by the performance of the signal source. Therefore, the external reference source must meet the source requirements mentioned in Figure 6-6

For 2-kHz SNR and ENOB evaluation at a maximum throughput of 1 MSPS, the number of samples must be 32768 or 65536. Any more samples bring the noise floor so low that the external source phase noise can dominate the SNR and ENOB calculations. However, for THD and SFDR evaluation, a larger number of samples must be used to reduce the noise floor below –140 dBc to analyze noise-free harmonics and spurs in the order of –120 dBc. Such analysis requires at least 262144 samples.
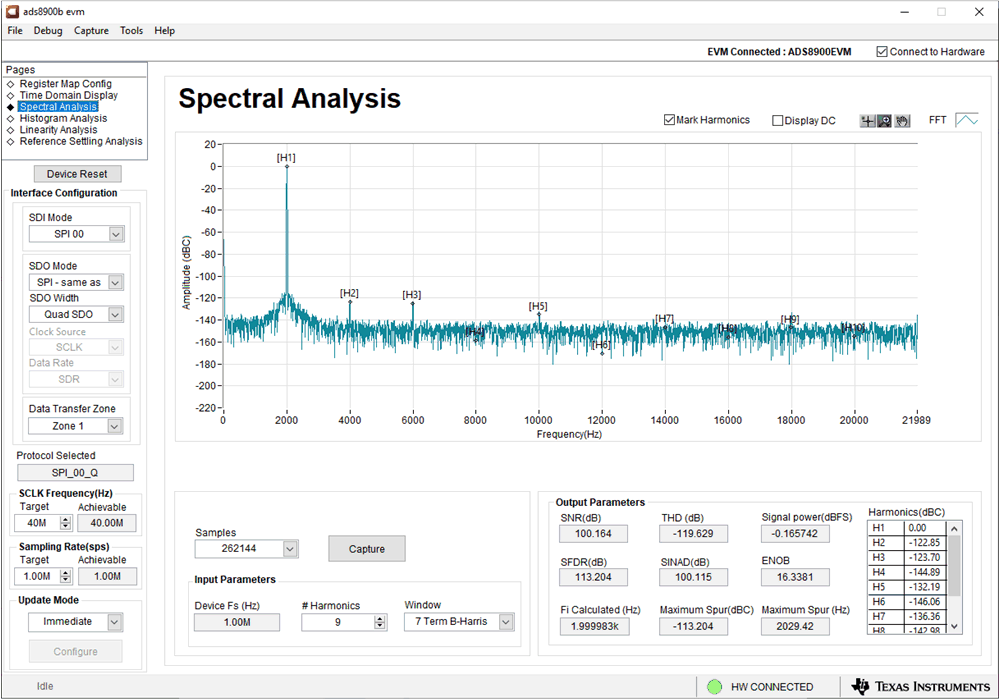
GUID-20210520-CA0I-4SC1-7MGG-6FND2S97LT5D-low.gif Figure 6-6 Spectral Analysis Tool
Note: The PSIEVM is often used to produce a single-tone sinusoidal signal. As shown in Figure 6-7, this GUI allows the PSIEVM software to be launched directly by clicking on Tools and then Lauch PSI.
Figure 6-7 Launch PSI