SBOA444 November 2020 TMCS1100
4.3.2 LED Pulse Generation
This implementation supports outputting energy consumption by using pulses that have a frequency that is proportional to the amount of energy consumption. This information can be used to accurately calibrate the system for energy accuracy measurement. Typically, the measuring element (the MSP432 microcontroller) is responsible for generating pulses proportional to the energy consumed. To serve both these tasks efficiently, the pulse generation must be accurate with relatively little jitter. Although time jitters are not an indication of bad accuracy, time jitters give a negative indication of the overall accuracy of the meter. The jitter must be averaged out due to this negative indication of accuracy.
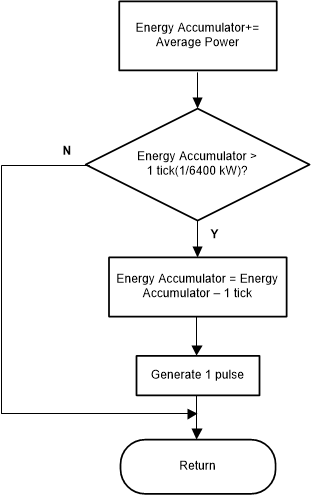
This application uses average power to generate these energy pulses. The average power accumulates at every DRDY port ISR interrupt, thereby spreading the accumulated energy from the previous one-second time frame evenly for each interrupt in the current one-second time frame. This accumulation process is equivalent to converting power to energy. When the accumulated energy crosses a threshold, a pulse is generated. The amount of energy above this threshold is kept and a new energy value is added on top of the threshold in the next interrupt cycle. Because the average power tends to be a stable value, this way of generating energy pulses is very steady and free of jitter.
The threshold determines the energy "tick" specified by equipment manufacturers and is a constant. The tick is usually defined in pulses-per-kWh or just in kWh. One pulse must be generated for every energy tick. For example, in this application, the number of pulses generated per kWh is set to 6400 for active and reactive energies. The energy tick in this case is 1 kWh / 6400. Energy pulses are generated and available on a header. The pulses can be viewed by probing the appropriate pins on the MSP432 LaunchPad. In this design, there are active and reactive pulses for a user-definable V-I mapping.
The Pulse Generation for Energy Indication figure shows the flow diagram for pulse generation.
 Figure 4-8 Pulse Generation for Energy
Indication .
1-kWh threshold = 1 / 0.001 × 1 kW × (Number of interrupts per sec) × (Number of seconds in one hour) = 1000000 × 7812.5 × 3600 = 0x19945CA26200