SBOA575 September 2023 INA823 , OPA2387 , XTR115 , XTR116
Appendix
Appendix 1: Load Cell and Experimentation Setup
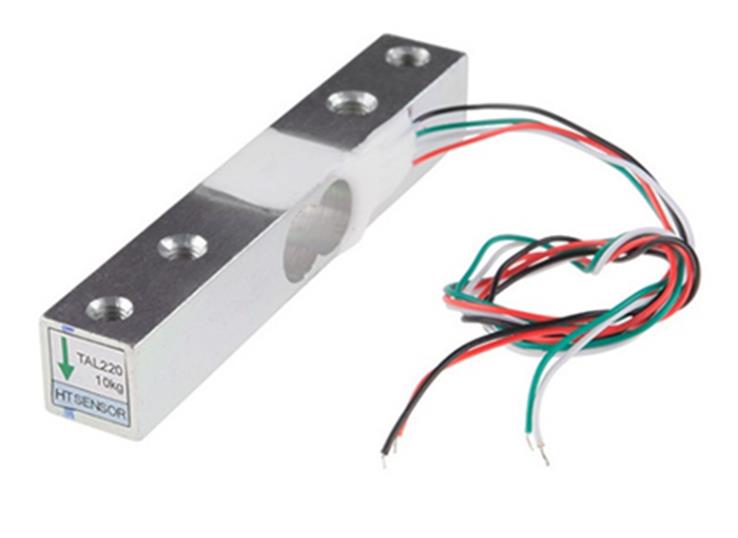
The SparkFun Electronics SEN-13329 10kg load cell was used for the Wheatstone bridge sensor. Figure 8-1 shows the sensor where the red, black, green, and white wires correspond to the Wheatstone outputs respectively.
 Figure 8-1 SparkFun Load Cell Selected
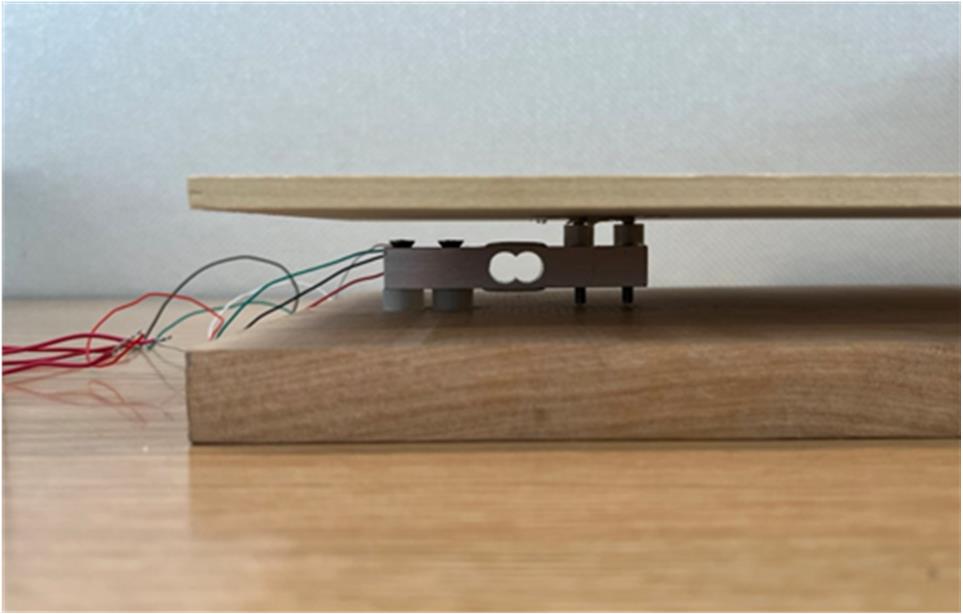
The load cell was secured with screws between two pieces of wood to make sure the sensor can compress freely. This process also created a stable platform to place weight plates and dumbbells. The wires of the load cell were attached to the PCB through a 4-input terminal block. Figure 8-2 shows the load cell setup.
 Figure 8-2 Mechanical Setup for Load Cell
When a weight was applied, a voltage measurement was taken between the two outputs of the bridge, at the INA output and at the output of the XTR. An HP 3458A multimeter was programmed to take 100 readings and the average value was used for each data point. It was vital to reset the load cell after each measurement by removing all weight and allowing the load cell to resettle.
Appendix 2: PCB Details
 Figure 8-3 PCB Top Layer
 Figure 8-5 PCB Signal Layer 2
 Figure 8-4 PCB Signal Layer 1
 Figure 8-6 PCB Bottom Layer
 Figure 8-7 PCB Altium Schematic