SLAAE50A January 2022 – October 2022 MSP430FR2533 , MSP430FR2533
3.4 Test Results
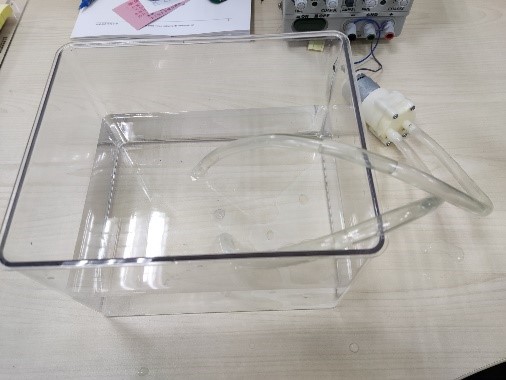
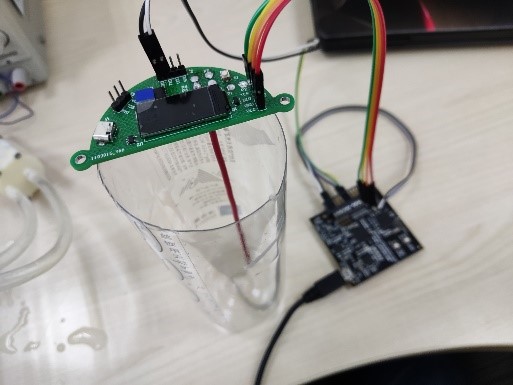
A. Test Environment
Figure 3-8 shows the test environment, which requires a sink, pump, PCB, and electrodes (metal bar). The PCB is designed to be semi-circular to facilitate filling the cup with water.
B. Electrode Connection Test
To explore the impact of different electrode connections on the measurement results, relative capacitance changes and height measurements were performed for different electrode connections. Four different electrode connection tests are carried out (see Figure 3-9).
 Figure 3-9 Four Different Electrode Connection Tests
Based on four different electrode connection methods, Figure 3-10 shows the test results.
 Figure 3-10 Relative Capacitance Change vs Height Curve of Four Connections
 Figure 3-11 Comparison of the Results of Test 1 Through Test 4
According to the test results, when Height < 10 mm, the error of all tests is large due to the poor curve fitting. In addition, Figure 3-11 shows that the performance of Test 3 was poor because the bottom copper wires of the two electrodes were connected together by water creating a short circuit. For the remaining three sets of tests, the trend of the curves is basically the same, and the performance of each test is carefully compared, as shown in Table 3-2.
| Test | Capacitance Change (H = 10 mm) | Linearity (R2) | Sensitivity (per 10 mm) |
|---|---|---|---|
| 1 | 14% | 0.9506 | 2.5% |
| 2 | 20% | 0.9477 | 2.88% |
| 3 | 110% | 0.6822 | 4.75% |
| 4 | 15% | 0.9806 | 3.25% |
According to this table, comprehensively comparing capacitance change (H=10mm), linearity and capacitive sensitivity, Test 4 has the best performance. Meanwhile, Test 4 has the simplest structure for easy implementation and application.
C. Absolute Capacitance Test
There are generally two measurement methods for capacitive test. The first one is to test relative capacitance change, and the other is test absolute capacitance change. In order to compare the difference between the two methods, the measurement of absolute capacitance was carried out at the same time as the above measurement. Here only take Test 1 is as an example, and the measurement results are showed in Figure 3-12.
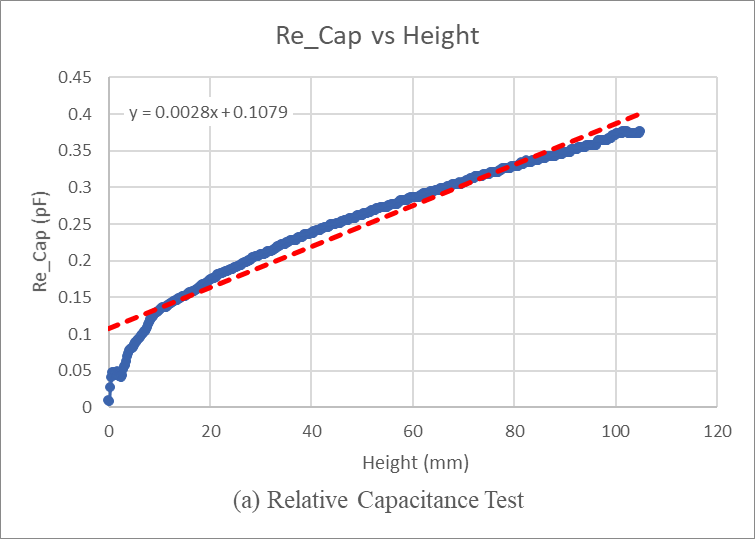
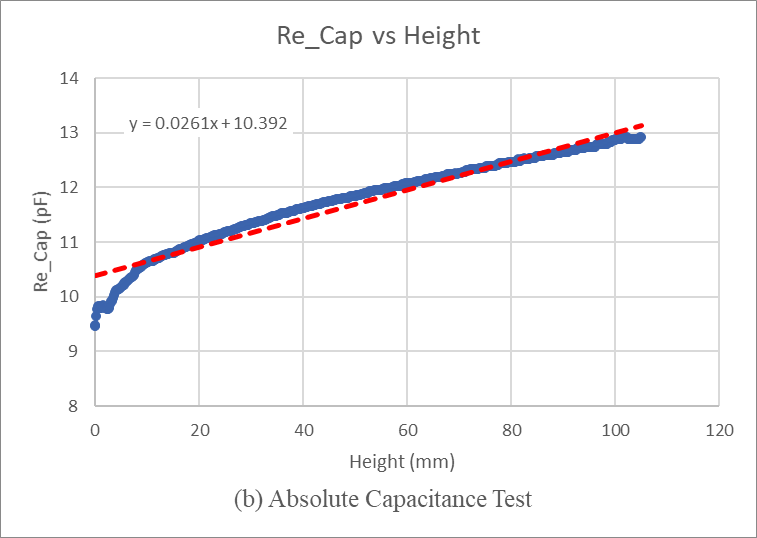
Comparing the above results, it is found that the absolute capacitance measurement can read the actual value of the capacitance, and it is between 9.5 and 13 pF. Its changing trend is the same as that of relative capacitance.
Comparing the resolutions of the two, since the base capacitance of the relative capacitance is smaller, the resolution during measurement is higher, but the absolute capacitance can suppress the influence of temperature drift on the measurement results. Therefore, in different applications, the corresponding measurement method can be selected for measurement.
D. Software Optimization
According to the previous test, when height is small (less than 20 mm), the curve fitting is not good (take Test 4 as an example), as shown in Figure 3-13, the fitting function can be expressed as: Y= 248.5X-21.604.
 Figure 3-13 Height vs Relative Capacitance Change Curve Fit
To express the measurement error more intuitively, the software is optimized for the measurement. When Height<20mm, use quadratic function fitting, when Height>20mm, use linear function fitting, as shown in Figure 3-14.
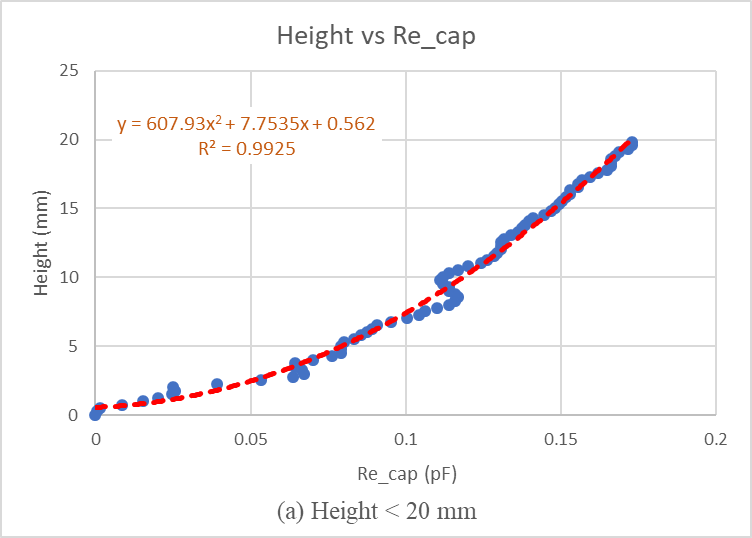
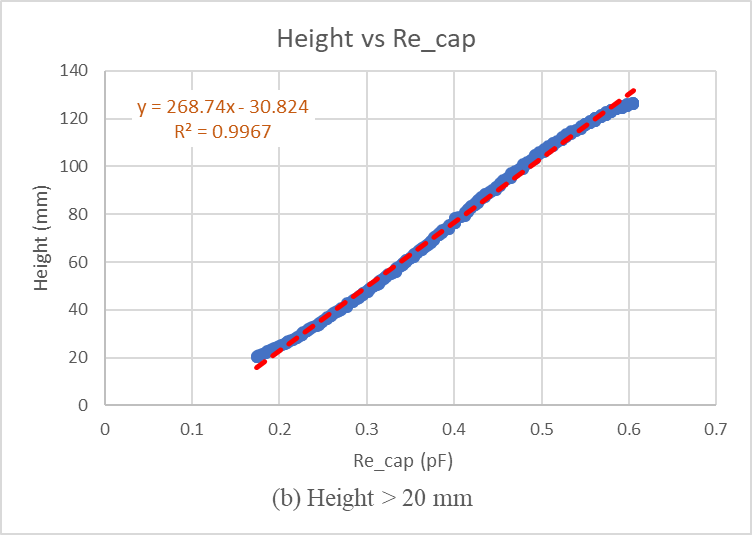
For the two fitting methods, measurements are taken every 10 mm, and Table 3-3 lists the obtained errors.
| Actual Height (mm) | LTA | Count | Delta | Simulation1 Height (mm) | Error1 (%) | Simulation2 Height (mm) | Error2 (%) |
|---|---|---|---|---|---|---|---|
| 10 | 496 | 319 | 0.111867 | 6.194880069 | -38.051199 | 8.96200886 | -10.379911 |
| 20 | 496 | 266 | 0.174327 | 21.71624618 | 8.581230 | 20.206227 | 1.031135 |
| 30 | 496 | 234 | 0.225738 | 34.49177474 | 14.972582 | 29.8407022 | -0.530992 |
| 40 | 496 | 212 | 0.267871 | 44.96186022 | 12.404650 | 41.1635625 | 2.908906 |
| 50 | 496 | 19 | 0.308591 | 55.08090783 | 10.161815 | 52.1067933 | 4.213586 |
| 60 | 496 | 183 | 0.344835 | 64.08754328 | 6.812572 | 61.8470074 | 3.078345 |
| 70 | 496 | 173 | 0.376422 | 71.93681205 | 2.766874 | 70.3355889 | 0.479412 |
| 80 | 496 | 163 | 0.411884 | 80.74918128 | 0.936476 | 79.865714 | -0.167857 |
| 90 | 496 | 155 | 0.443548 | 88.61777419 | -1.535806 | 88.3751936 | -1.805340 |
| 100 | 496 | 147 | 0.478659 | 97.3428126 | -2.657187 | 97.8108749 | -2.189125 |
Figure 3-15 shows the test error of the two methods.
 Figure 3-15 Test Error Comparison
Obviously, the first method has a very large error before 20 mm, and the second method uses a quadratic function to fit when height<20 mm, and the overall error is within 10.4%, which greatly reduces the measurement error.
In conclusion, according to the above measurement results, in this experiment, the use of a single electrode (Test 4), relative capacitance and software optimization can get the better measurement results. Of course, according to different application, other measurement methods or electrode connection methods can be selected.