TIDT179A may 2020 – april 2023
3.2 Output Voltage Ripple
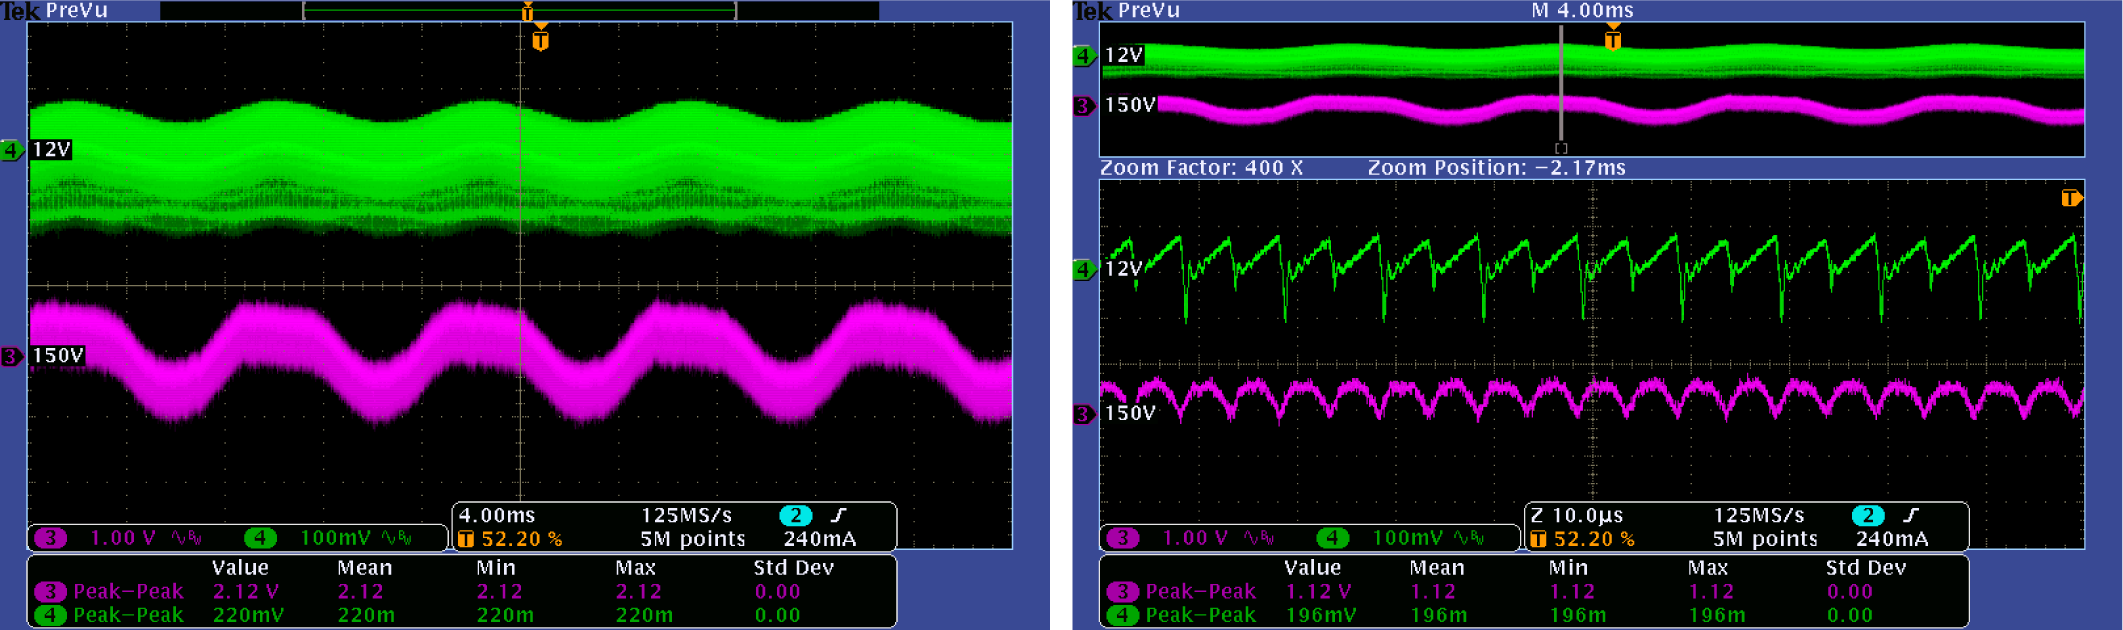
The following waveforms show the output voltage ripple at full load condition with 115 VAC, 60 Hz applied to the AC input. The oscilloscope probes are AC coupled. (CH3: 150V output, CH4: 12V output)
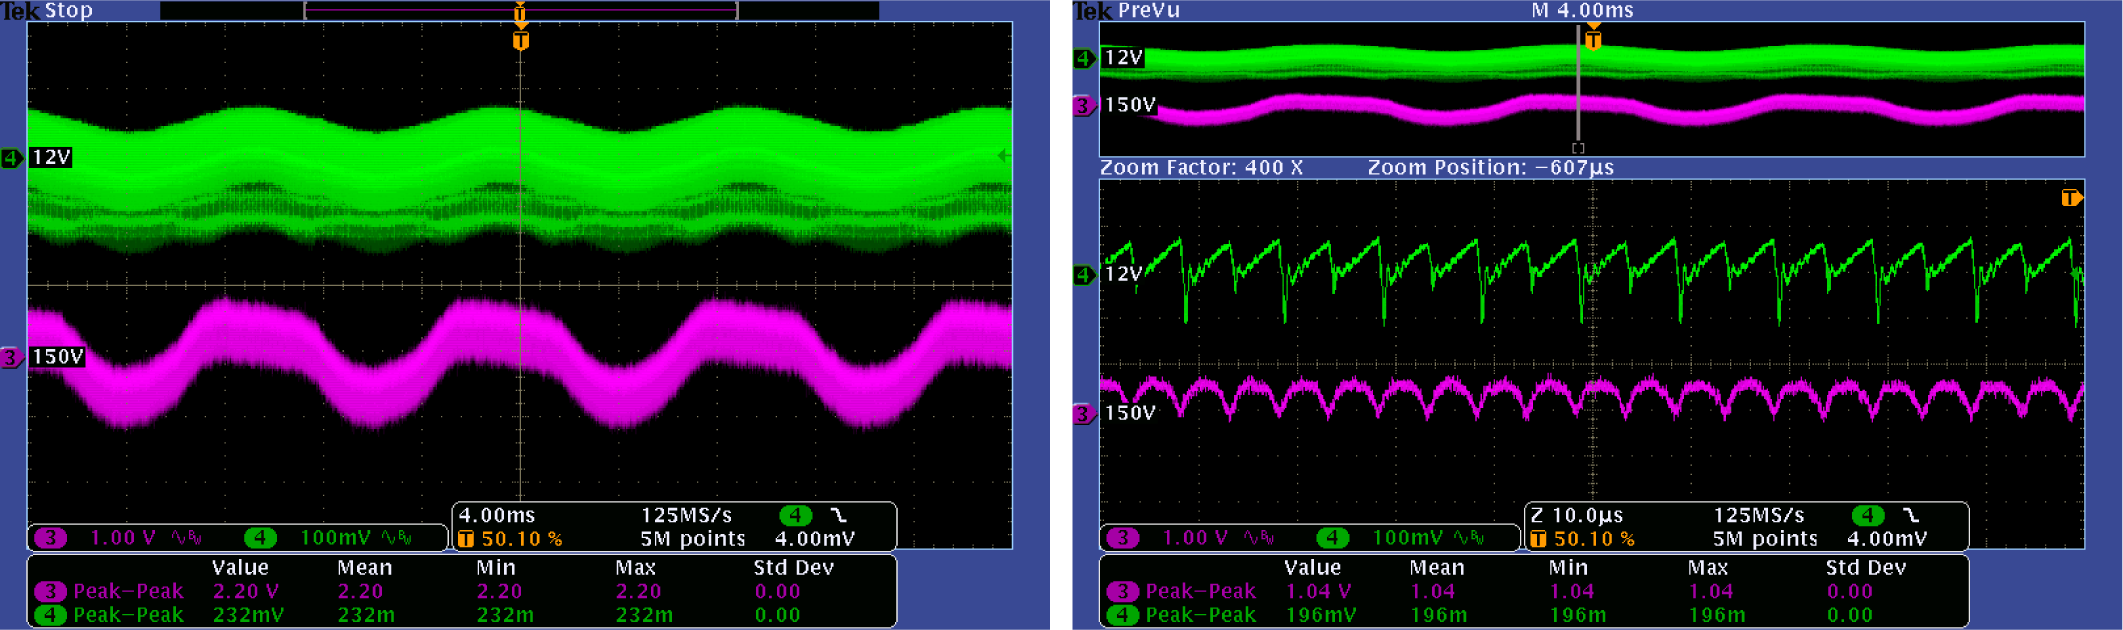
The following waveforms show the output voltage ripple at full load condition with 230 VAC, 50 Hz applied to the AC input. The oscilloscope probes are AC coupled. (CH3: 150V output, CH4: 12V output)
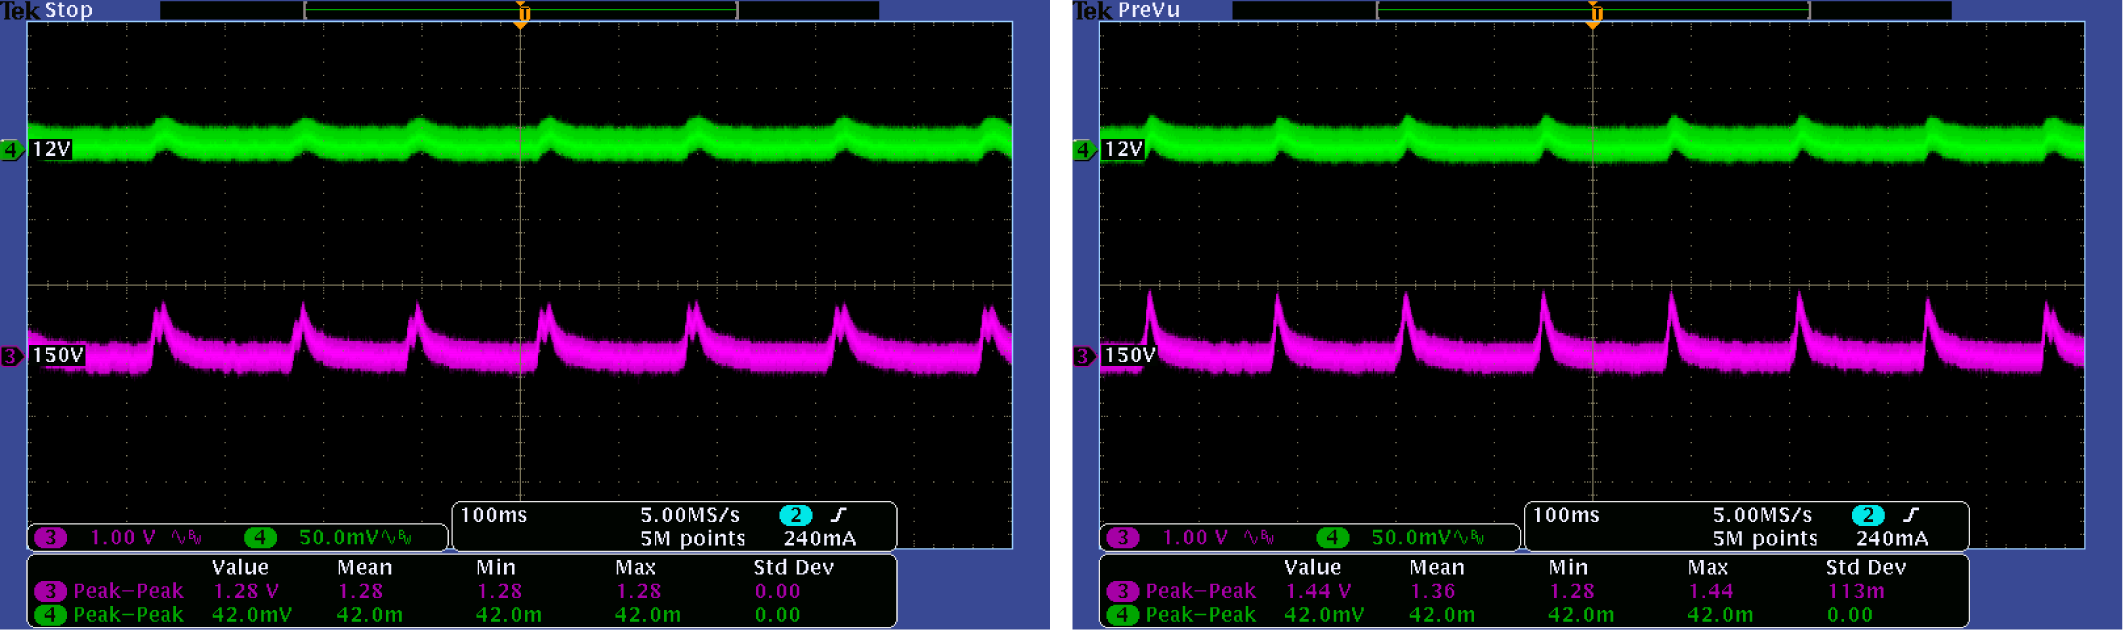
The following waveforms show the output voltage ripple at no load condition with 115 VAC, 60 Hz (right photo) and 230 VAC, 50Hz (left photo) applied to the AC input. The oscilloscope probes are AC coupled. (CH3: 150V output, CH4: 12V output)