JAJSFM0E September   1997  – June 2018 ISO124

PRODUCTION DATA.  

  1. 特長
  2. アプリケーション
  3. 概要
    1.     Device Images
      1.      概略回路図
  4. 改訂履歴
  5. Pin Configuration and Functions
    1.     Pin Functions
  6. Specifications
    1. 6.1 Absolute Maximum Ratings
    2. 6.2 ESD Ratings
    3. 6.3 Recommended Operating Conditions
    4. 6.4 Thermal Information
    5. 6.5 Electrical Characteristics
    6. 6.6 Typical Characteristics
  7. Detailed Description
    1. 7.1 Overview
      1. 7.1.1 Modulator
      2. 7.1.2 Demodulator
    2. 7.2 Functional Block Diagram
    3. 7.3 Feature Description
      1. 7.3.1 Isolation Amplifier
    4. 7.4 Device Functional Modes
  8. Application and Implementation
    1. 8.1 Application Information
      1. 8.1.1 Carrier Frequency Considerations
      2. 8.1.2 Isolation Mode Voltage Induced Errors
      3. 8.1.3 High IMV dV/dt Errors
      4. 8.1.4 High Voltage Testing
    2. 8.2 Typical Applications
      1. 8.2.1 Output Filters
        1. 8.2.1.1 Design Requirements
        2. 8.2.1.2 Detailed Design Procedure
        3. 8.2.1.3 Application Curves
      2. 8.2.2 Battery Monitor
      3. 8.2.3 Programmable Gain Amplifier
      4. 8.2.4 Thermocouple Amplifier
      5. 8.2.5 Isolated 4-mA to 20-mA Instrument Loop
      6. 8.2.6 Single-Supply Operation of the ISO124 Isolation Amplifier
      7. 8.2.7 Input-Side Powered ISO Amplifier
      8. 8.2.8 Powered ISO Amplifier With Three-Port Isolation
  9. Power Supply Recommendations
    1. 9.1 Signal and Supply Connections
  10. 10Layout
    1. 10.1 Layout Guidelines
    2. 10.2 Layout Example
  11. 11デバイスおよびドキュメントのサポート
    1. 11.1 ドキュメントのサポート
      1. 11.1.1 関連資料
    2. 11.2 ドキュメントの更新通知を受け取る方法
    3. 11.3 コミュニティ・リソース
    4. 11.4 商標
    5. 11.5 静電気放電に関する注意事項
    6. 11.6 Glossary
  12. 12メカニカル、パッケージ、および注文情報

パッケージ・オプション

デバイスごとのパッケージ図は、PDF版データシートをご参照ください。

メカニカル・データ(パッケージ|ピン)
  • NVF|8
  • DVA|8
サーマルパッド・メカニカル・データ
発注情報

Typical Characteristics

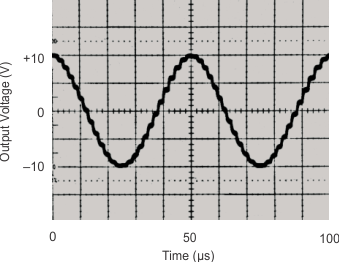
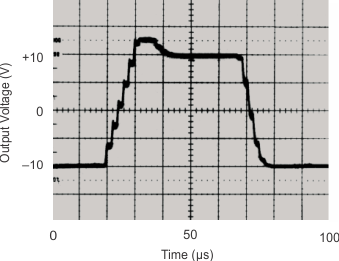
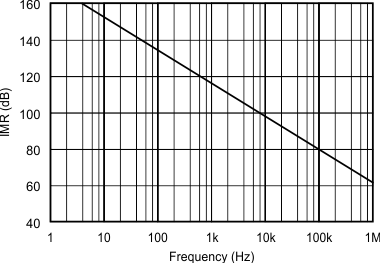
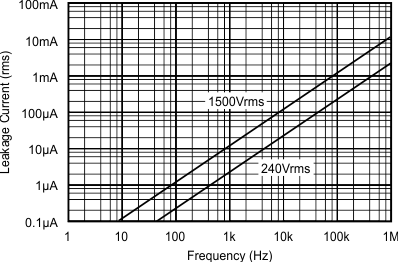
at TA = +25°C, and VS = ±15 V (unless otherwise noted)
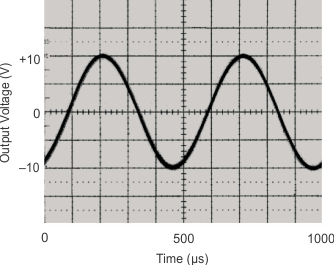
ISO124 graph_1_sbos074.gif
f = 2 kHz
Figure 1. Sine Response
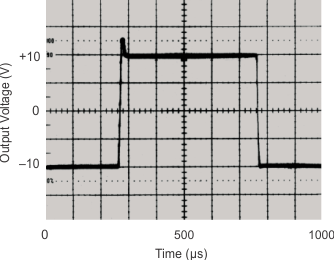
ISO124 graph_3_sbos074.gif
Figure 3. Step Response
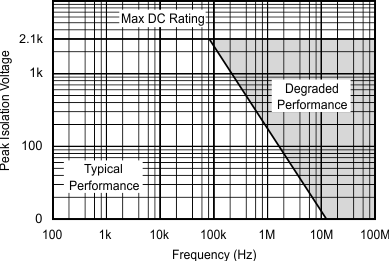
ISO124 graph_5_sbos074.gif
Figure 5. Isolation Voltage vs Frequency
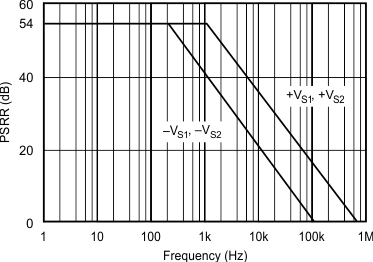
ISO124 graph_7_sbos074.gif
Figure 7. PSRR vs Frequency
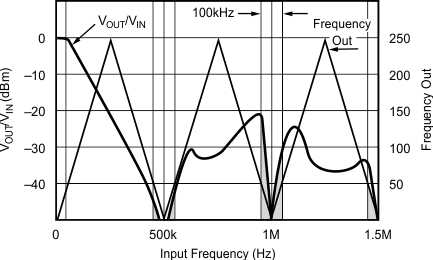
ISO124 graph_9_sbos074.gif
NOTE: Shaded area shows aliasing frequencies that cannot be removed by a low-pass filter at the output.
Figure 9. Signal Response to Inputs Greater than 250 kHz
ISO124 graph_2_sbos074.gif
f = 20 kHz
Figure 2. Sine Response
ISO124 graph_4_sbos074.gif
Figure 4. Step Response
ISO124 graph_6_sbos074.gif
Figure 6. IMR vs Frequency
ISO124 graph_8_sbos074.gif
Figure 8. Isolation Leakage Current vs Frequency