JAJU680A January   2019  – July 2022


  1.   概要
  2.   Resources
  3.   特長
  4.   アプリケーション
  5.   5
  6. 1System Description
    1. 1.1 Key System Specifications
  7. 2System Overview
    1. 2.1 Block Diagram
    2. 2.2 Design Considerations
      1. 2.2.1 Flow Measurement
      2. 2.2.2 ToF Measurement
        1. 2.2.2.1 ADC-Based Acquisition Process
        2. 2.2.2.2 Ultrasonic Sensing Flow-Metering Library
      3. 2.2.3 Low-Power Design
        1. 2.2.3.1 Energy-Efficient Software
        2. 2.2.3.2 Optimized Hardware Design
        3. 2.2.3.3 Efficient Use of FRAM
        4. 2.2.3.4 The LEA Advantage
    3. 2.3 Highlighted Products
      1. 2.3.1 MSP430FR6043
      2. 2.3.2 OPA836 and OPA838
      3. 2.3.3 TS5A9411
    4. 2.4 System Design Theory
      1. 2.4.1 Signal Processing for ToF
  8. 3Hardware, Software, Testing Requirements, and Test Results
    1. 3.1 Required Hardware and Software
      1. 3.1.1 Hardware
        1. 3.1.1.1 EVM430-FR6043
      2. 3.1.2 Software
        1. 3.1.2.1 MSP Driver Library (MSP DriverLib)
        2. 3.1.2.2 Ultrasonic Sensing Flow Metering Library
        3. 3.1.2.3 Application
          1. 3.1.2.3.1 Application Customization
          2. 3.1.2.3.2 LCD Stand-Alone Mode
        4. 3.1.2.4 USS Design Center (PC GUI)
      3. 3.1.3 Transducer and Meter
        1. 3.1.3.1 Frequency Characterization of Transducer and Meter
    2. 3.2 Testing and Results
      1. 3.2.1 Test Setup
        1. 3.2.1.1 Connecting Hardware
        2. 3.2.1.2 Building and Loading Software
          1. 3.2.1.2.1 Using Code Composer Studio IDE
          2. 3.2.1.2.2 Using IAR Embedded Workbench IDE
        3. 3.2.1.3 Executing Application
        4. 3.2.1.4 Configure Device and Observe Results Using GUI
        5. 3.2.1.5 Customization and Optimization
      2. 3.2.2 Test Results
        1. 3.2.2.1 Single-Shot Standard Deviation
        2. 3.2.2.2 Zero-Flow Drift
        3. 3.2.2.3 Absolute Time of Flight Measurements
        4. 3.2.2.4 Variability in Zero Flow Drift Across Transducers
        5. 3.2.2.5 Flow Measurements
        6. 3.2.2.6 Average Current Consumption
        7. 3.2.2.7 Memory Footprint
  9. 4Design and Documentation Support
    1. 4.1 Design Files
      1. 4.1.1 Schematics
      2. 4.1.2 Bill of Materials
      3. 4.1.3 PCB Layout Recommendations
        1. 4.1.3.1 Layout Prints
      4. 4.1.4 Altium Project
      5. 4.1.5 Gerber Files
      6. 4.1.6 Assembly Drawings
    2. 4.2 Software Files
    3. 4.3 Related Documentation
    4. 4.4 Terminology
    5. 4.5 Trademarks
    6. 4.6 サポート・リソース
  10. 5About the Authors
  11. 6Revision History

Flow Measurements

Flow measurements were performed on a 3D printable pipe with 200-kHz, 400-kHz, and 500-kHz transducers available from Jiakang, Hurricane, CeramTec, and Audiowell. The transducers are available from their respective manufacturers, and the 3D printable pipe design can be obtained from Texas Instruments.

Variable flow rate testing was conducted with an ACE60 12V DC fan connected to the 3D printed pipe with 200-kHz transducers. Figure 4-18 shows the results of the differential ToF (dToF) and absolute ToF (aTOF) at different flow rates ranging from 12000 lph to 0 lph. The flow rate was initially decreased in steps of 2000 lph until the minimum operating voltage of the fan was reached. The flow rates appear negative because air was pulled(instead of pushed) through the pipe. The dToF of the 3D printed gas pipe was calibrated against a reference meter which was connected in series.
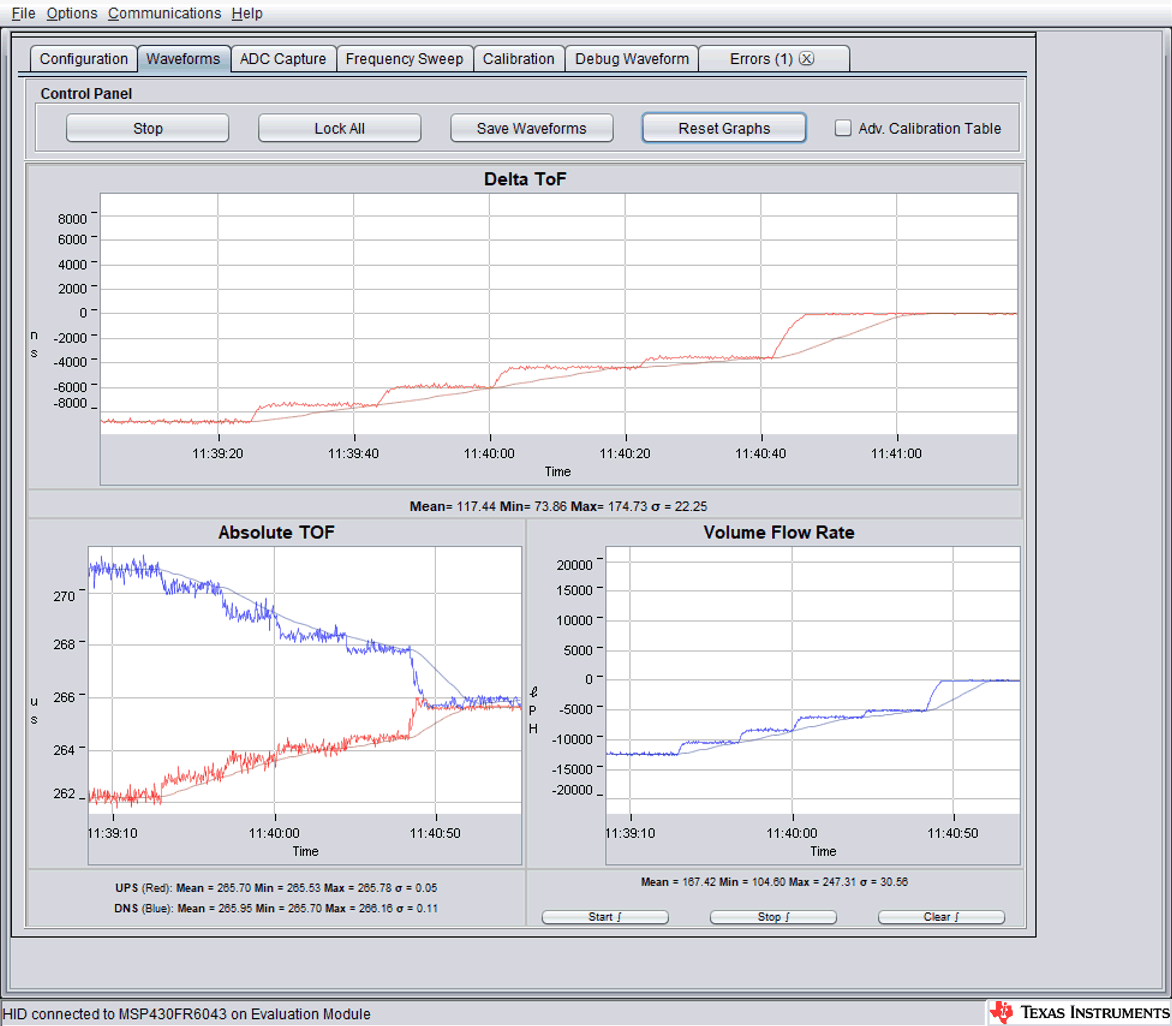
GUID-56CA6ED1-3234-4E72-91D8-34A70DDF416F-low.pngFigure 4-18 Flow Rate Testing