SLAA913A January 2020 – June 2021
4.2 Average Current Consumption
Further testing was done, using a TI proprietary tool, which uses the EnergyTrace™ method on more advanced hardware and software, resulting in less than 3 percent deviation from an Agilent Technologies N6705B power anlyzer.
This TI tool captured current profiles for 100 seconds and calculated the average values over a user-defined period, either 60 seconds with one RF transmission included or any time slot between transmissions. Tests were done with 3.0- and 2.0-V power supplies to emulate the initial and end-of-life voltages of a CR2032 coin cell or any other primary LiMnO2 battery. A special firmware was developed and tested, where the HDC sensor was read out every 10 seconds but the RF transmission happens every 60 seconds. This was needed to evaluate the effect of the Sensor Controller as well as the sensor data buffering prior to transmission. The duty-cycling solution is represented by the TIDA-00484 design, with its results documented in the Humidity and Temperature Sensor Node for Sub-1GHz Star Networks Enabling 10+ Year Coin Cell Battery Life design guide.
The test results shown in columns 1 and 2 of Table 4-1 were delivered by a N6705B power analyzer with Keysight 14585A software.
| Standby (main MCU reads HDC2010), Iaverage [60 s] | Sensor Controller (SCE reads HDC2010), Iaverage [60 s] | Duty-cycling (measured in TIDA-00484) | |
| HDC2010 every 10 s, RF every 60 s [3.0 V]/[2.0] | 2181 nA / 3040 nA | 1666 nA / 2565 nA | na |
| HDC2010 every 60 s, RF every 60 s [3.0 V]/[2.0] | 1686 nA / 2542 nA | 1693 nA / 2576 nA | 1957 nA |
The results show that using the Sensor Controller only once per 60 seconds is not achieving any power savings compared to the Standby solution (see Table 4-1). The power consumption values of these two solutions are identical when comparing 1686 and 1693 nA for the 60 s sensor read-out and wireless transmission period. The values in Table 4-1 are the average result of three test runs per each combination of supply voltage, sensor sampling rate and StandBy or Sensor Controller.
If the sensor is read every 10 seconds then the advantage of using the SCE peripheral becomes visible. Reading the sensor even more often further increases the benefit of utilizing the SCE peripheral. The duty-cycling approach at 60 seconds sensor sampling period is less power efficient as the inactivity time is too short and restarting and reinitializing the full system needs more energy than it saves in between.
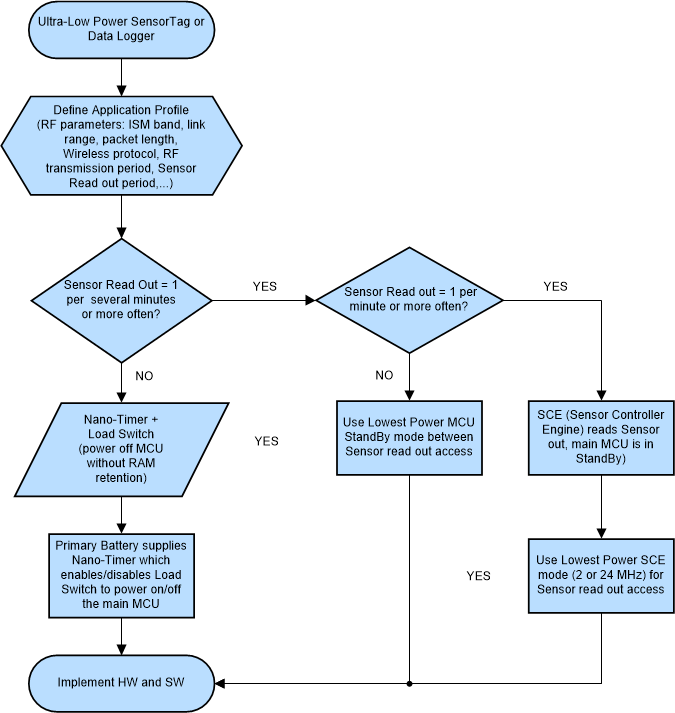
 Figure 4-2 Ultra-low Power Decision Tree for Standby, Sensor Controller and Duty-Cycling
The flow chart in Figure 4-2 is based on the test results and is a decision tree for easy estimation of which system approach to consider when ultra-low power is the key application requirement. Duty-cycling (with nano-timer and load switch) is most efficient with a low duty cycle of at least 1-2 minutes or longer inactivity times.
StandBy is the easiest to implement (no SCE code development needed) and performs better than Duty-cycling for 1 minute sensor sampling time.
The Sensor Controller performs equal to StandBy when the sensor readout occurs every minute (confirmed with N6705B measurement data in Table 4-1) and delivers power savings with higher sensor readout frequency, such as every 10 seconds.
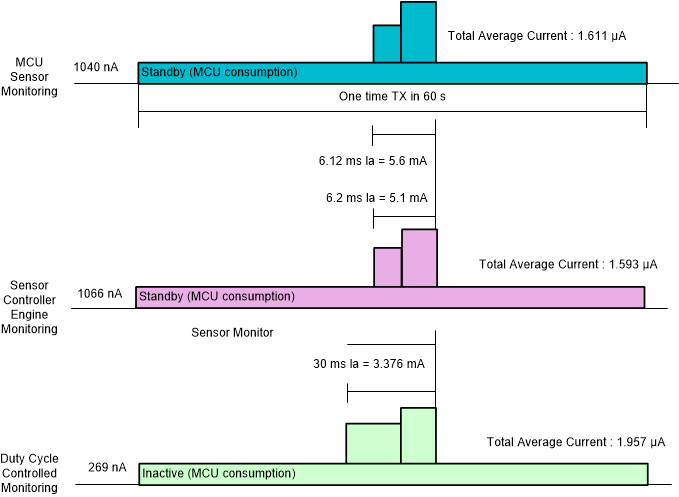
A graphical representation of the three solutions with the average current during inactivity (Sensor and Wireless MCU are in standby or completely powered off) and during sensor readout and subsequent RF packet transmission is shown in Figure 4-3. The current values herein were measured with TI's Energy Tool.
 Figure 4-3 Simplified Current Profiles (Comparison)
The average current of duty cycle controlled monitoring is 1.957 µA at 3 V, as the TIDA-00484 design shows. The newly-introduced Sensor Controller Engine approach draws 1.593 µA at 3 V, or nearly 20% less power consumption in this application.
An excel sheet is used to create the table comparing the three solutions, based upon the same 240 mAh CR2032 coin cell capacity and battery life formula as described in the TIDA-00484 design.
 Figure 4-4 System Solutions Comparison (Sensor Readout and Data Transmission Once per Minute)