SLVAF16A March 2021 – December 2021 AFE7920 , AFE7950 , TPS541620 , TPS62912 , TPS62913
2.3 Test Results
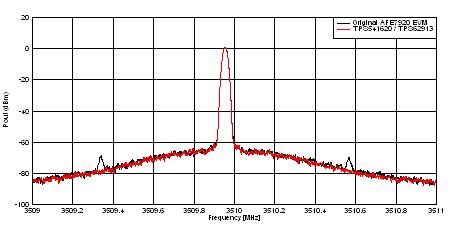
Performance tables and graphs comparing the original AFE7920 Original EVM with the TPS541620/TPS62913 modified board are shown below.
RX (Receive) SNR and SFDR
The FFT spectral plot is shown for an input frequency of 3.51 GHz, NCO of 3.5 GHz, and notch of 150. Figure 2-2 shows the performance of the standard EVM compared with the TPS541620/TPS62913 board. No close-in spurious on either board. The SNR and SFDR performance between the two units is roughly the same; however, the TPS541620/TPS62913 board achieves slightly better very close-in noise as shown in the spectrum close to the carrier as shown by the phase noise spread. The original board achieved -50dBFS, where the TPS541620/TPS62913 board achieved -62 dBFS, which shows improved performance with the new design.
TX (Transmit) Spectrum
Figure 2-4 show the transmit spectrum performance close to the carrier at 2 MHz span between the standard EVM compared with the TPS62913. Both boards show good performance, although the original AFE7920 board shows a spur at ~613kHz, likely from the original switching power supply. The TPS541620/TPS62913 low noise board has a clean spectrum and an increased switching frequency of 1 MHz.
 Figure 2-4 2 MHz Span TX
Spectral Plot
Figure 2-4 2 MHz Span TX
Spectral Plot| Configuration | Input Voltage and Current | Input Power |
|---|---|---|
| Input Power for the 1.8 V rails with the Original AFE7920 EVM with DC-DC converters + LDOs | 5.6 V @ 1.165 A | 6.526 W |
| Input Power for the 1.8 V rails with two TPS62913 | 5.6 V @ 0.944 A | 5.286 W |
| Input Current and Power Savings for the 1.8 V rails | 221 mA input current reduction | 1.24 W Power Savings |
The following are thermal images of the power supplies running when taking data for the power performance comparison tables.
Original Board DC-DC Max Temp is 47.9 C
Original Board LDO Max Temp is 57.7 C
Original Board LDO Max Temp is 53.7 C
Original Board LDO Max Temp is 46.9 C
TPS62913 Max Temp is 52.4 C
Original Board DC-DC Max Temp is 54.0 C
Original Board DC-DC Max Temp is 57.7 C
TPS541620 Max Temp is 59.3 C