TIDT179A may 2020 – april 2023
2.3 Standby Efficiency Data
Standby input power was measured with 5 minute averaging under below conditions:
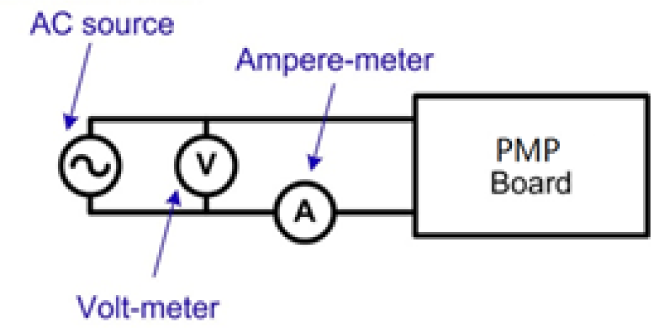
The following measurement was done with Yokogawa WT210 power meter and Chroma 61503 AC source. On the WT210 power meter, voltage range was set to 150V for low line input, 300V for high line input. Current range was set to Auto with crest factor 6 for low line and high line. Also, the voltage measurement and current measurement was configured as below:
Below is the standby load power measurement with PSON set to low and 150 V output unloaded.
| VINAC (V) | PIN (mW) | VOUT1 (V) | VOUT2 (V) | POUT1 (mW) | POUT2 (mW) |
|---|---|---|---|---|---|
| 90 | 161 | 9.72 | 135.05 | 100.00 | 0.00 |
| 115 | 179 | 9.72 | 135.00 | 100.00 | 0.00 |
| 230 | 193 | 9.74 | 135.00 | 100.00 | 0.00 |
| 264 | 199 | 9.73 | 135.13 | 100.00 | 0.00 |
| 90 | 231 | 9.73 | 137.66 | 150.00 | 0.00 |
| 115 | 231 | 9.72 | 137.74 | 150.00 | 0.00 |
| 230 | 242 | 9.73 | 137.65 | 150.00 | 0.00 |
| 264 | 253 | 9.71 | 137.73 | 150.00 | 0.00 |
| 90 | 302 | 9.73 | 140.80 | 200.00 | 0.00 |
| 115 | 300 | 9.72 | 140.80 | 200.00 | 0.00 |
| 230 | 311 | 9.72 | 140.63 | 200.00 | 0.00 |
| 264 | 319 | 9.73 | 140.80 | 200.00 | 0.00 |