TIDT246 September 2021
3.5 Voltage Regulation
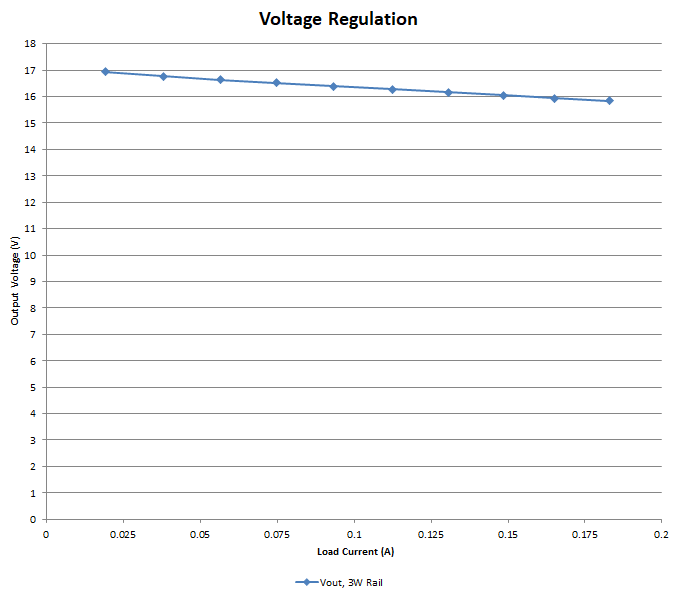
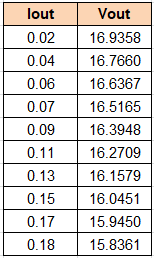
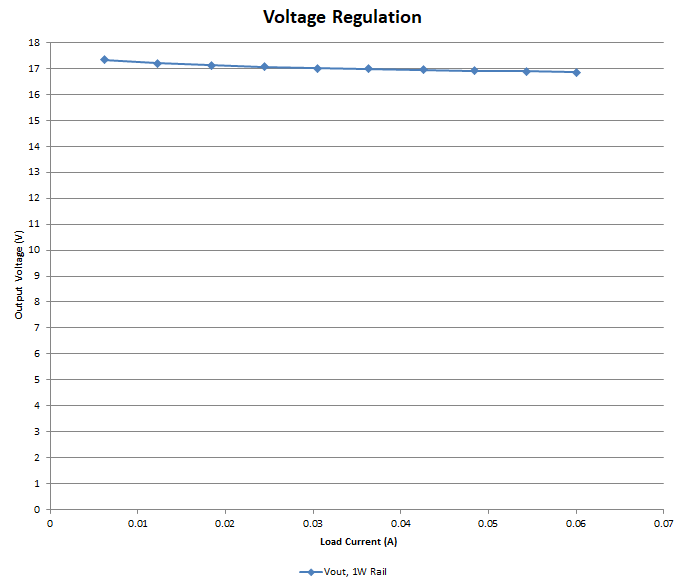
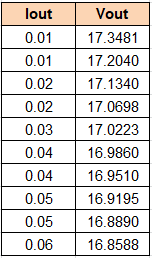
The voltage regulation of the LLC converter outputs is shown in the following figures.
 Figure 3-10 3-W Rail Regulation Graph
 Figure 3-11 3-W Rail Regulation Table
 Figure 3-12 1-W Rail Regulation
 Figure 3-13 1-W Rail Regulation Table
The cross regulation was measured to showcase the effects of varying load on the other outputs of the LLC converter. The 3-W rail (Vo3W) and one of the 1-W rails (Vo1W3) were varied while the other 2 rails (Vo1W1 and Vo1W2) were held constant.
 Figure 3-14 Cross Regulation Table