TIDT273 April 2022
2.5 Thermal Images
Figure 2-5 through Figure 2-7 were taken at 19 VDCin; full load, 15 minute soak, room temperature, no airflow, and no heat sink.
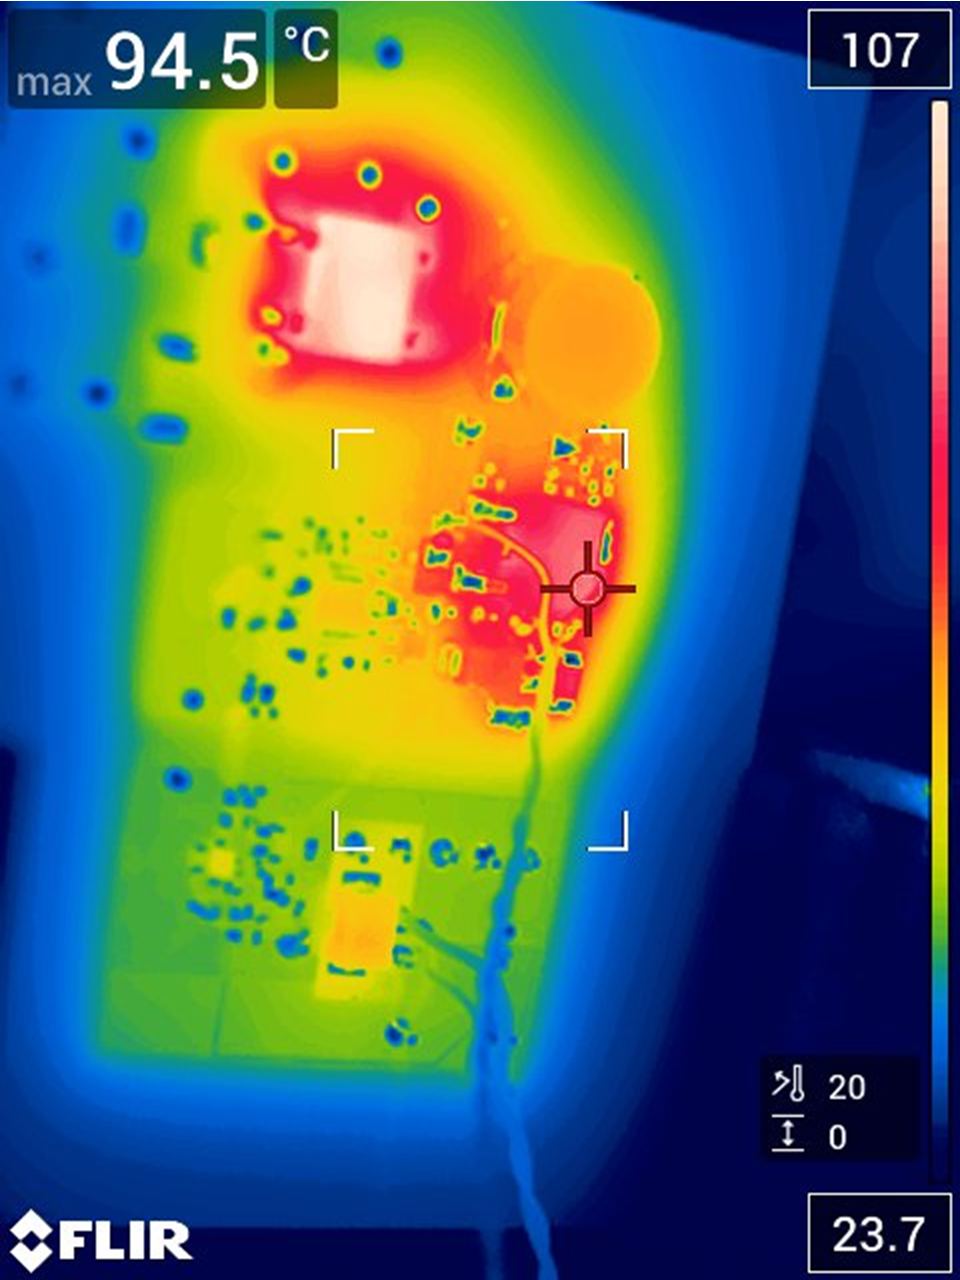 Figure 2-5 Back of the Board Showing Q2, D3, and R2 at About
94.5°C
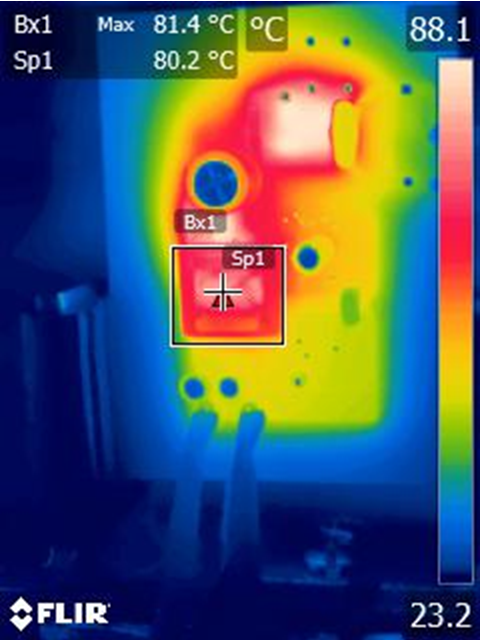 Figure 2-7 Front of the Board – Transformer Showing
80°C
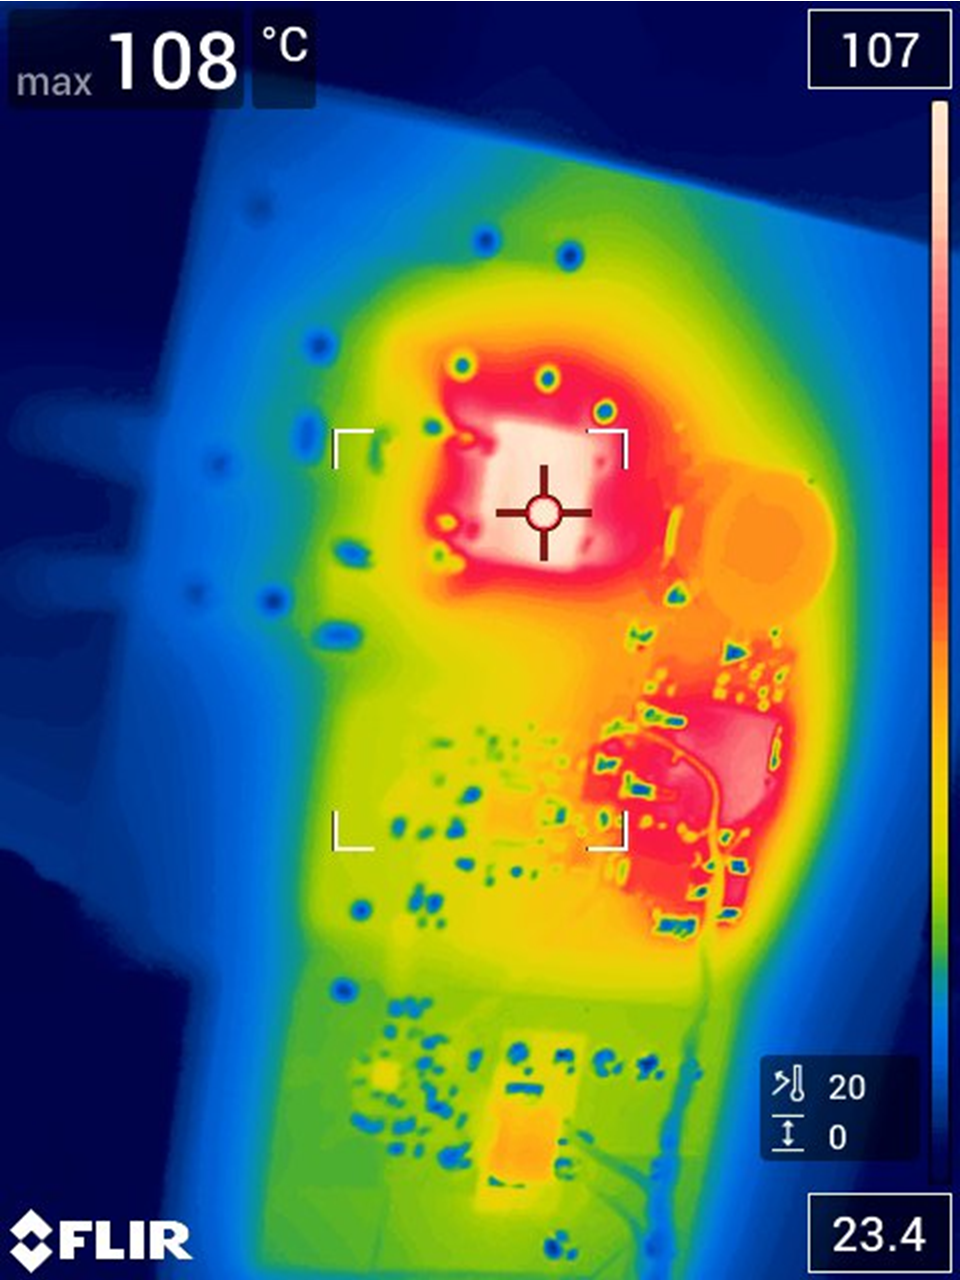 Figure 2-6 Dbridge = 108°C
Figure 2-8 and Figure 2-9 were taken at 85 VACin; full load, 15 minute soak, room temperature, no airflow, and no heat sink.
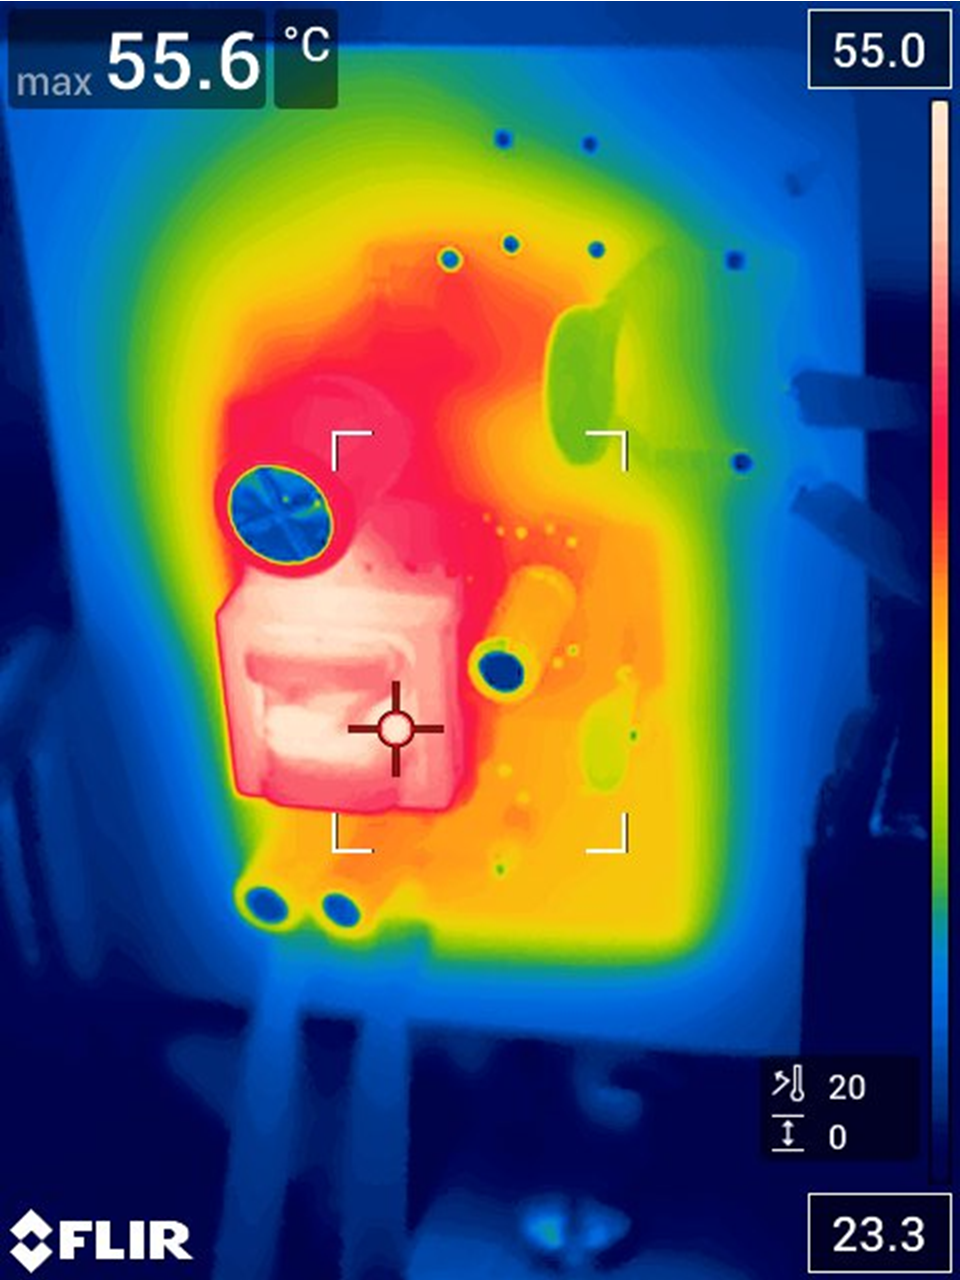 Figure 2-8 Front of the Board - Transformer
Showing 55°C
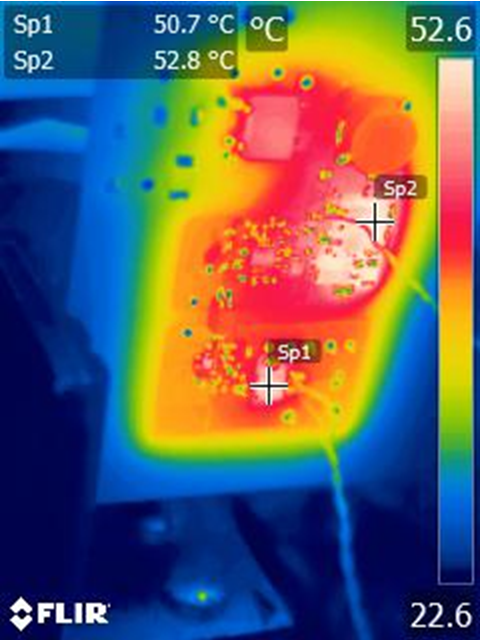 Figure 2-9 Bottom of Board Showing Dout =
50.7°C; Qpri = 52.8°C
Figure 2-9 Bottom of Board Showing Dout =
50.7°C; Qpri = 52.8°CFigure 2-10 and Figure 2-11 were taken at 275 VACin; full load, 15 minute soak, room temperature, no airflow, and no heat sink.
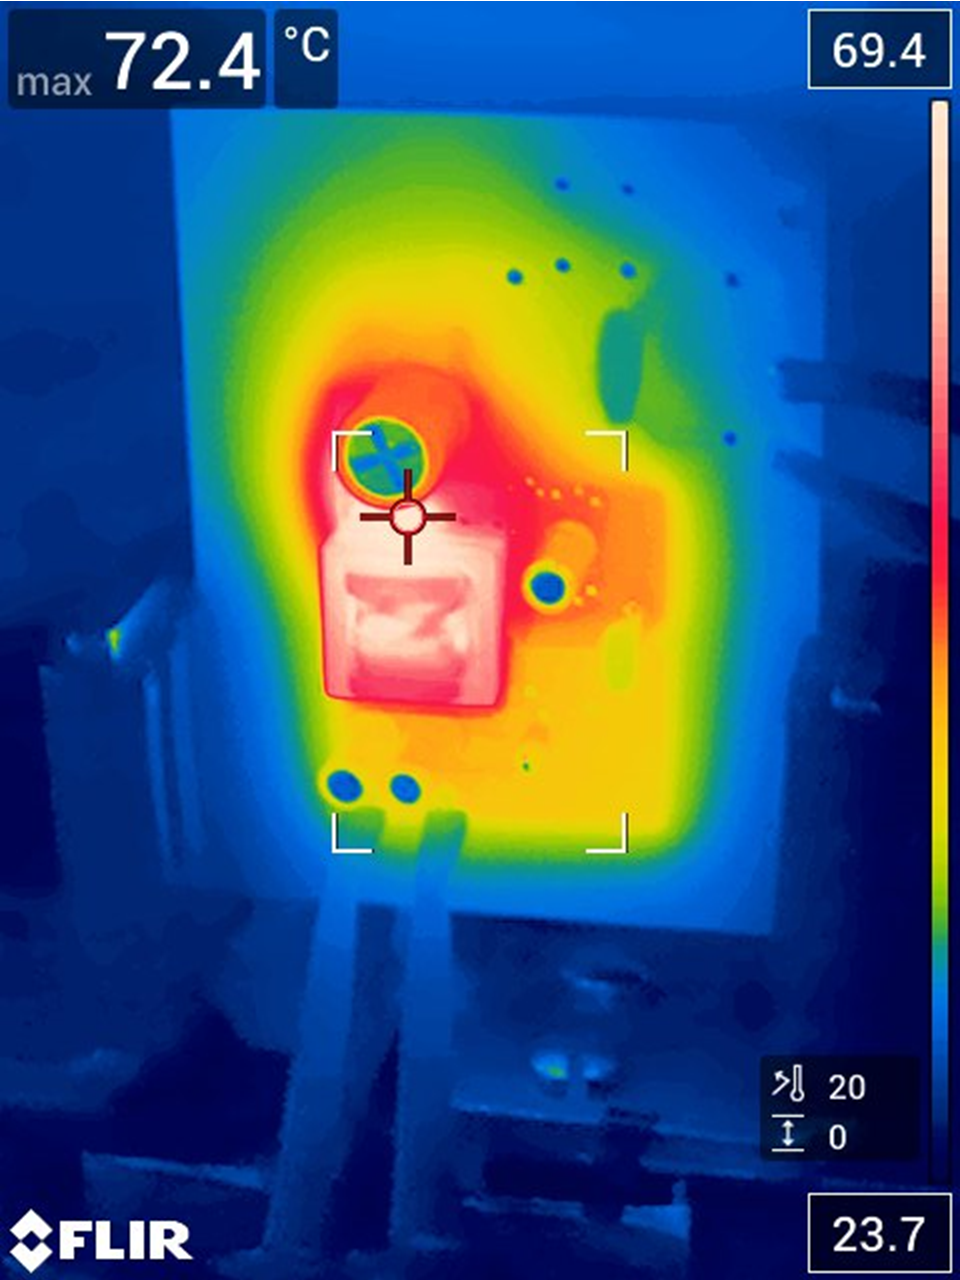 Figure 2-10 Top of Board Showing XFMER =
72.4°C
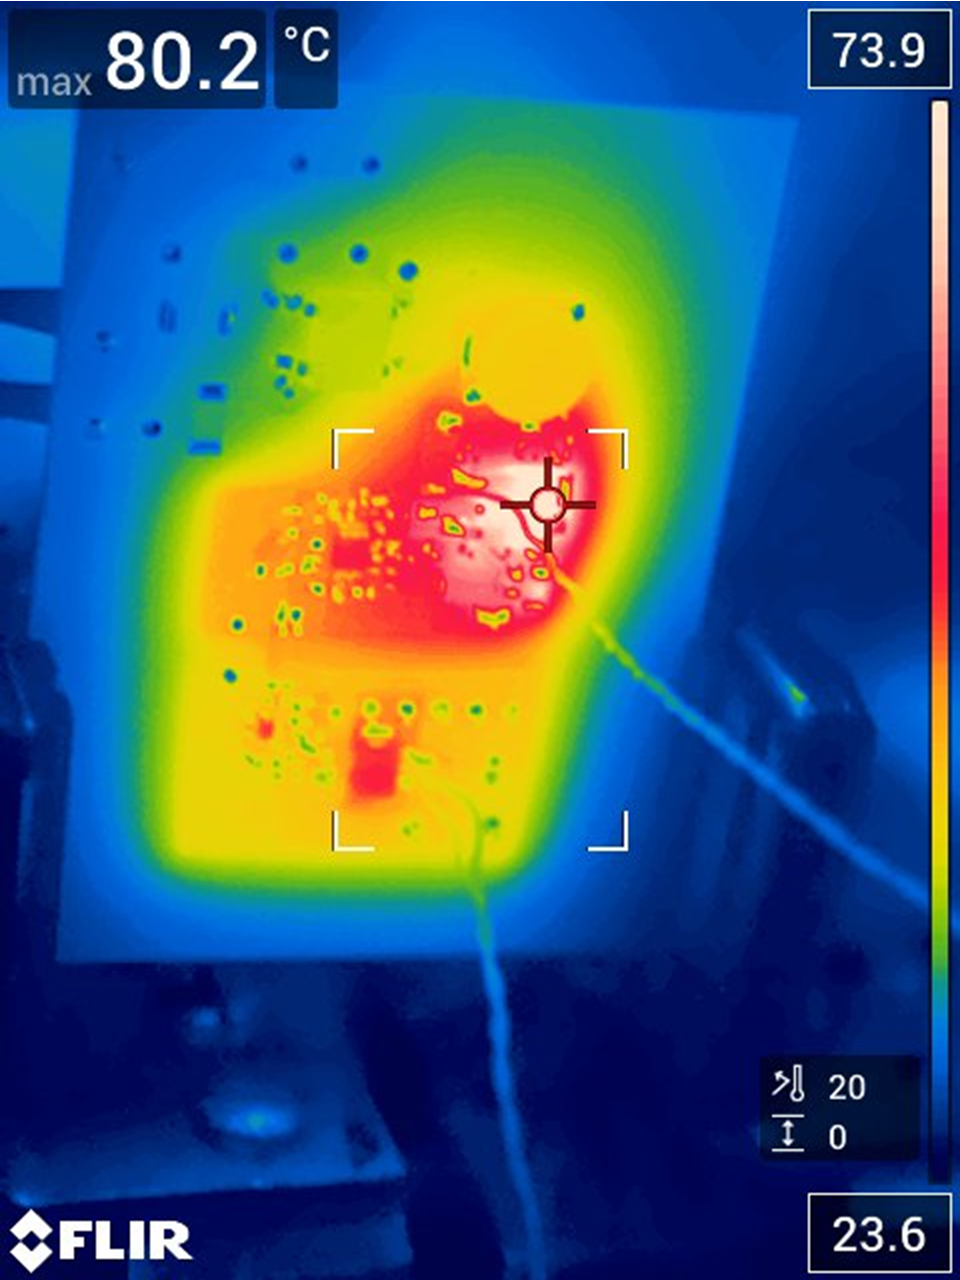 Figure 2-11 Bottom of Board Showing Q2 at
80°C