TIDT279 October 2022
3.3 Start-Up of Each Independently-Controlled Output
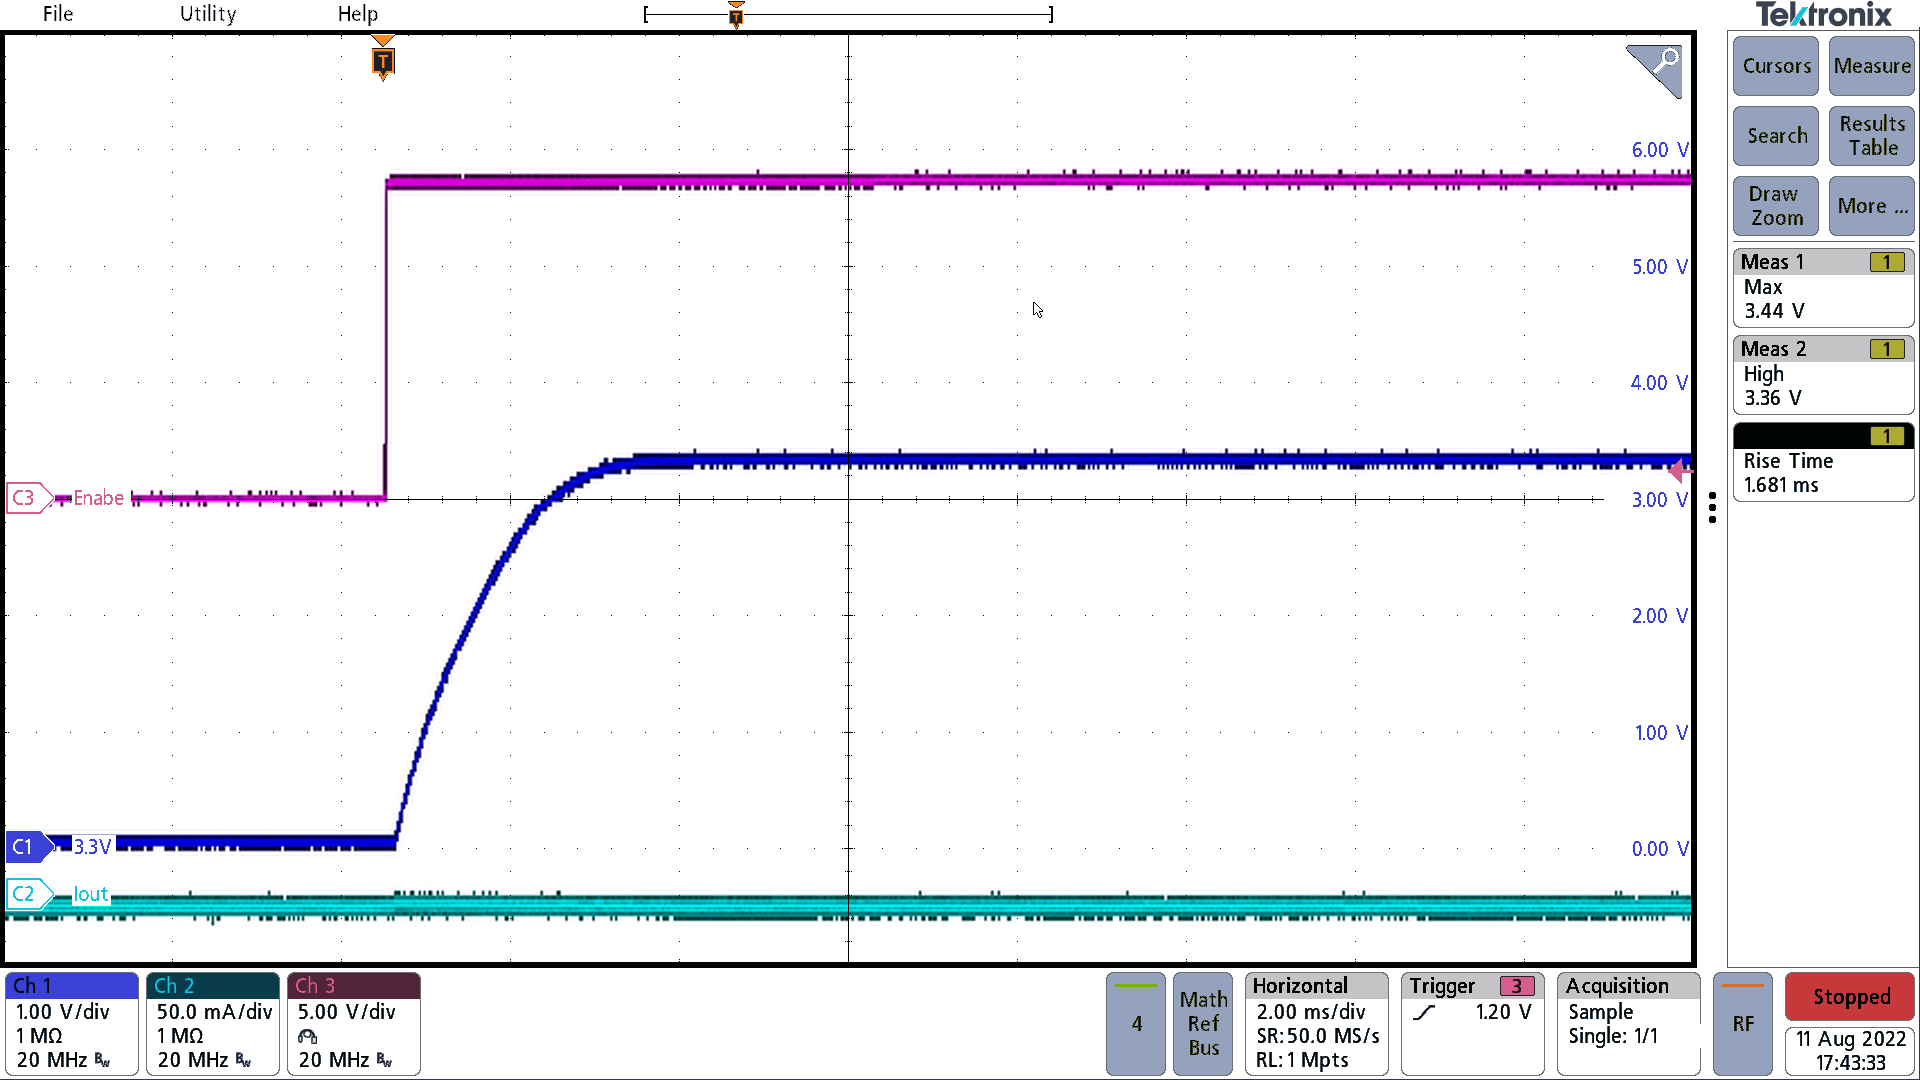
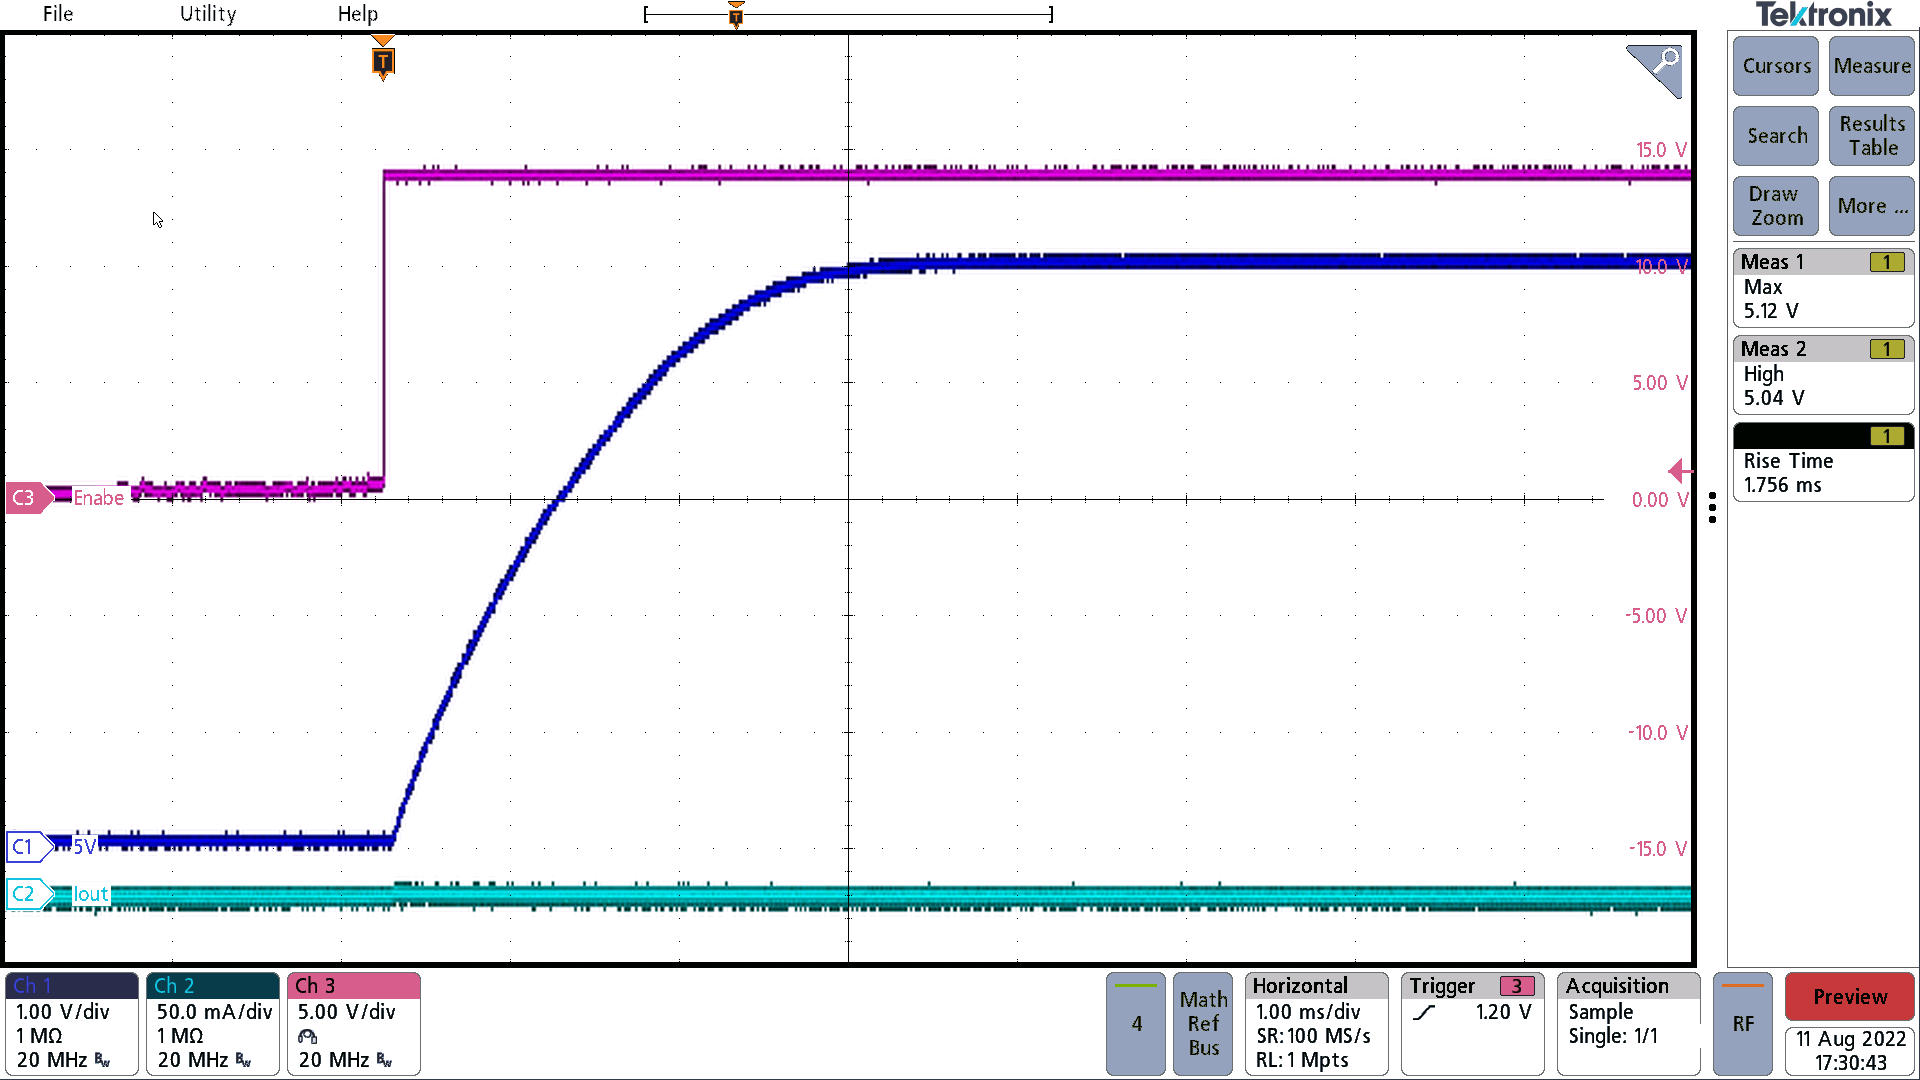
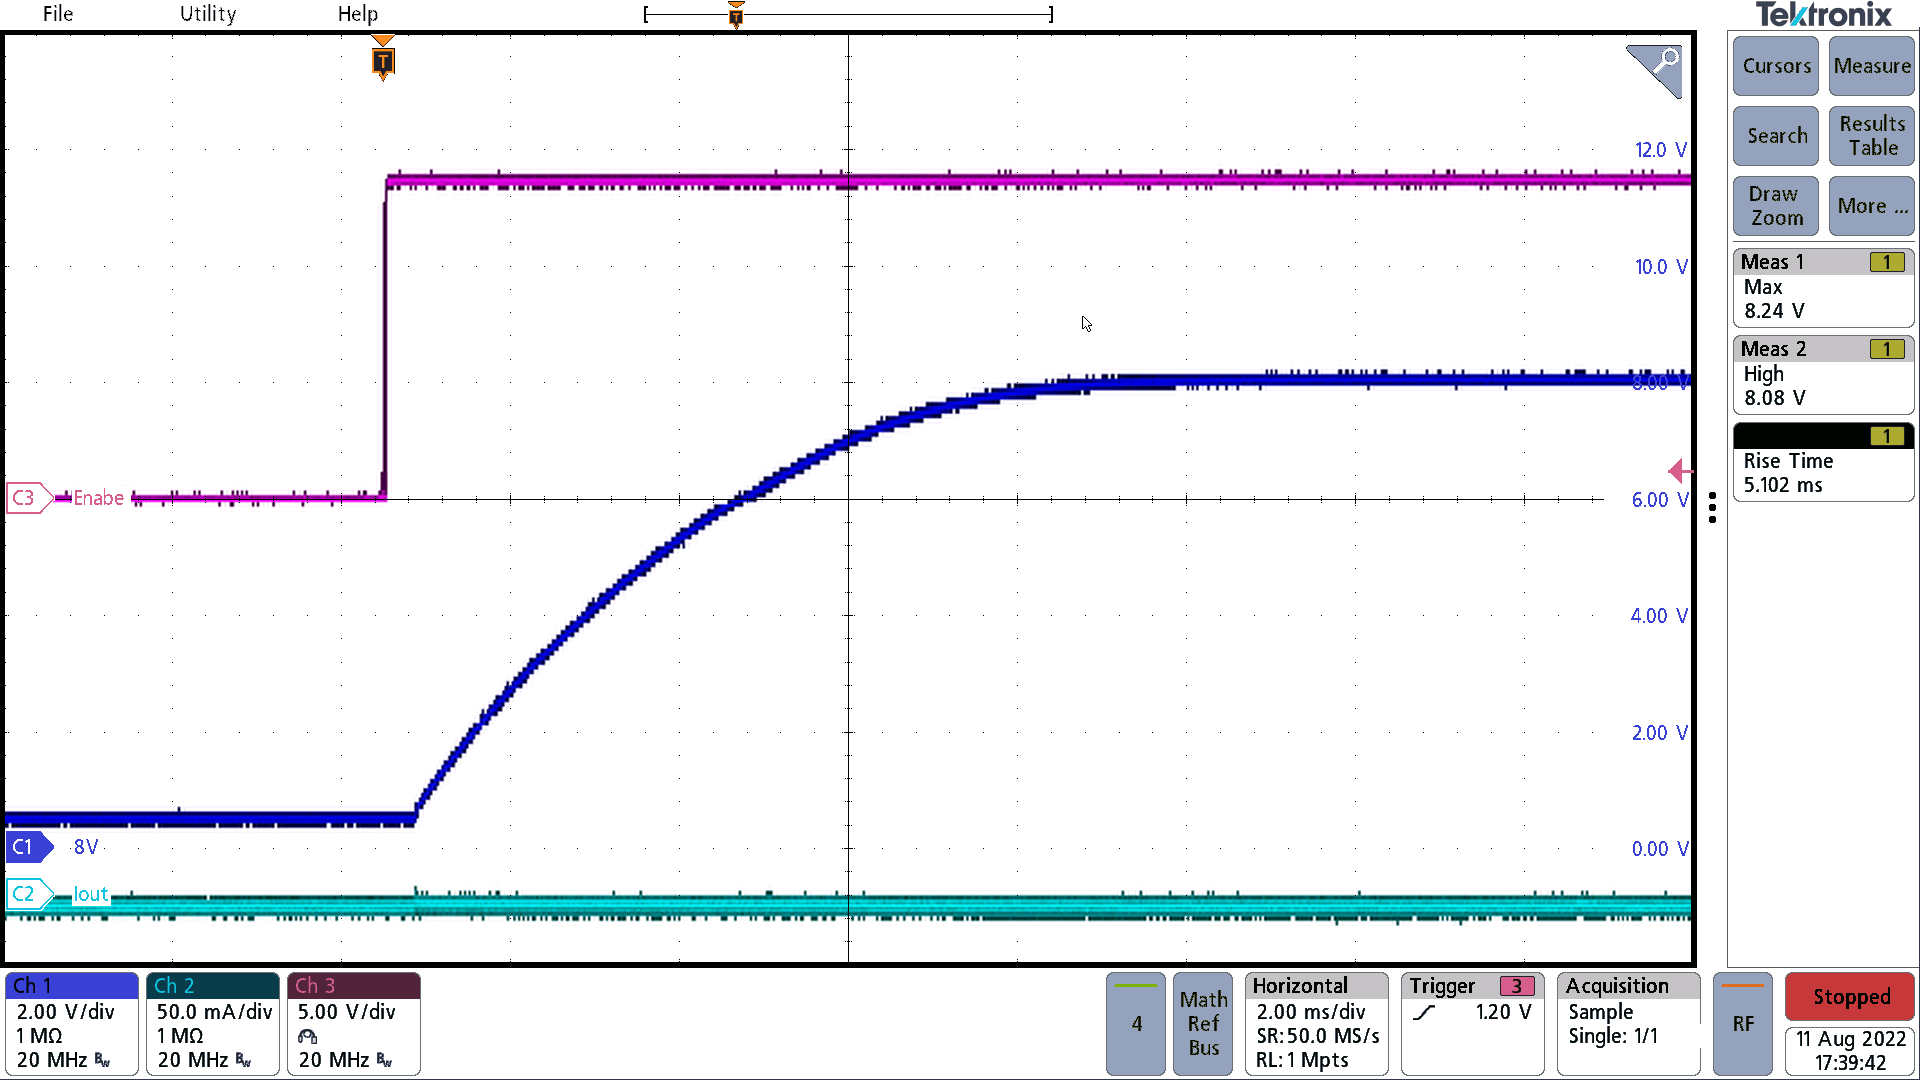
Start-up behavior is shown in the following figures.

Enable going high: Red trace is
the enable signal, the dark blue trace is VOUT, and the light blue
trace is the load current. Smooth VOUT rise in under 2.5 ms with no
overshoot seen.
Figure 3-6 Start-Up 3.3-V No-Load Off 14
VIN From 3.3 V 
Enable going high: Enable going
high: the red trace is the enable signal, the dark blue trace is
VOUT, and the light blue trace is the load current. Smooth 5
VOUT rise in under 3 ms with no overshoot seen.
Figure 3-7 Start-Up 5-V No-Load off 14
VIN From 5 V
Enable going high: Enable going
high: the red trace is the enable signal, the dark blue trace is
VOUT, and the light blue trace is the load current. Smooth 8
VOUT rise in under 10 ms with no overshoot seen.
Figure 3-8 Start-Up 8-V No-Load off 14
VIN From 8 V