SSZT161 may 2021

As embedded application developers, the last thing you want is for customers to run across latent bugs in your application code – especially when those bugs occur in portions that were not covered by your testing. Measuring code coverage is the only way to proactively prevent this. For developing any application measuring code coverage a good idea. When you start to consider functional safety applications, such as those in industrial and automotive markets, code coverage becomes a requirement.
Dynamic code coverage measures the effectiveness of your code during testing, helping ensure that (ideally) all sections of your code have an associated test. Unexecuted code may be more likely to contain bugs that arise after application deployment.
The TI Arm Clang set of compiler tools for TI Arm® Cortex® microcontrollers includes support for dynamically generated source-based code coverage for embedded applications. TI has implemented this support as a feature of the compiler itself. Unlike what many other vendors offer, these tools provide a level of coverage functionality that is accurate, easy to set up, and free to use. Code coverage can help you ensure the testing of all execution paths within your application, and it can also help you meet functional safety requirements. It is the first free, functional-safety-qualified code coverage tool available.
TI Arm Clang enables you to measure code coverage using the same compiler tools with which you conduct development in five easy steps:
- Generate instrumented binaries. You must build the source code with instrumentation options to ensure the allocation of counters and the instrumentation of code blocks with instructions to increment each counter.
- Retrieve the counters from memory. After loading and running the application at least once, retrieve the counters from memory and write them to a raw profile counter file on the host. You can use a compiler runtime support routine, the Code Composer Studio™ software scripting console or any other convenient means of reading memory to retrieve the data. You can retrieve the counters multiple times for each execution.
- Process the raw profile counter file into an indexed profile data file. You should produce an indexed profile data file for each executable that you run; this data file is based on a raw profile counter file that the tiarmprofdata tool has retrieved from memory and processed. The indexed profile data file maps the counter data to functions and source code regions.
- Merge the indexed profile data files together. Use the tiarmprofdata tool to merge multiple indexed profile data files into a single file.
- Visualize the code coverage. Providing the single merged indexed profile data file (along with each of the corresponding executables) as input to the tiarmcov visualization tool will enable you to visualize the code coverage. You can use the visualization tool to generate a dump of the source file along with the summary report, as shown in Figure 1, in either HTML or text format.
 Figure 1 Summary Report
View
Figure 1 Summary Report
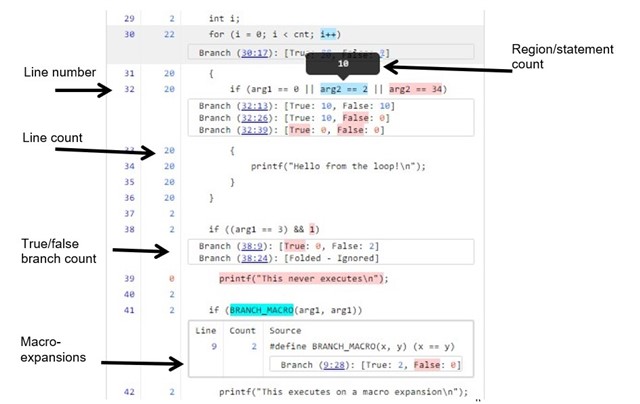
ViewFigure 2 offers a source file view with details about each coverage criterion.
 Figure 2 View of Coverage Criterion
Details
Figure 2 View of Coverage Criterion
DetailsConclusion
Dynamically generated code coverage can help you produce reliable code by ensuring the sufficient testing of all execution paths throughout your application in order to reduce the chances of lurking defects. You can read more about TI Arm Clang’s support for code coverage in the TI Arm Clang User’s Guide.
While using TI Arm Clang code coverage is straightforward from the command line, the next phase of support is to fully integrate it into the Code Composer Studio integrated development environment (IDE) in order to make the instrumentation, counter retrieval, processing and visualization steps easy to enable and perform.
Start now to see how well your code is covered. Check out this application report to help you leverage TI Arm Clang code coverage within the Code Composer Studio IDE.
Additional Resources
- Download the TI Arm Clang compiler.
- Read the technical article, “The future of compiler tools for TI Arm® Cortex®-based MCUs.”