SSZT776 march 2018 TPS543C20
When designing a step-down buck converter, converter stability should be a top priority. The converter is stable when the phase margin of the loop gain is greater than 0 degrees, with an acceptable minimum phase margin of 45 degrees. Maintaining a constant phase margin when the power-stage components vary as much as 50% from their original values can be a challenge for circuit designers. For example, the values of the inductor and capacitors change with their bias operating conditions and temperature range.
Using the new advanced current mode (ACM) control topology in TI’s TPS543C20 synchronous step-down SWIFT™ converter, I compared the shape of the phase in three separate cases. In each case, I change the value of the output capacitor, inductor and both the output capacitor and inductor without making any other modifications to the circuit. I used the single-phase TPS543C20EVM-799 evaluation module (EVM) to perform the comparison under these test conditions:
- Input voltage = 5V, output voltage = 0.9V, switching frequency = 500kHz.
- Original inductor value = 470nH (0.165mΩ direct current resistance [DCR]).
- Original output capacitor = 2 x 330µF (3mΩ equivalent series resistance [ESR]) + 3 x 100µF (1206 size ceramic capacitor).
- Output load configured as a 10A resistive power resistor.
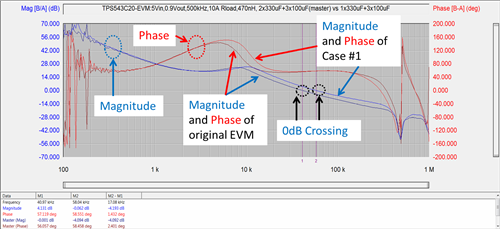
Case No. 1, Illustrated in Figure 1
 Figure 1 Bode Plot Comparison between Original Configurations versus Case No. 1
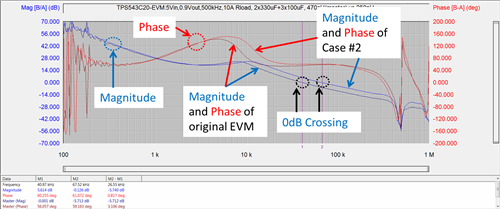
Case No. 2, Illustrated in Figure 2
 Figure 2 Bode Plot Comparison between Original Configurations versus Case No. 2
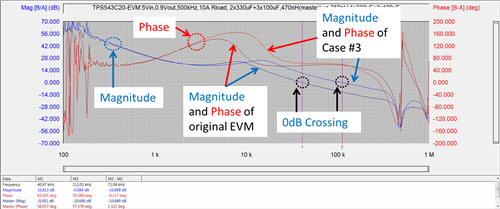
Case No. 3, Illustrated in Figure 3
 Figure 3 Bode Plot Comparison between Original Configurations versus Case No. 3
The shape of the phase in the ACM topology stays constant over a decade frequency range when the power component changes its value, such as a 53% inductor reduction from 470nH to 250nH. However, you still need to pay attention to the changing value of power-stage components so that the phase margin of your converter meets the minimum requirement.
Additional resources:
- Read the white paper, “Internally Compensated Advanced Current Mode.”
- Read a blog post about the effects of gate-driver strength in synchronous buck converters.