SSZTA82 april 2017 MSP430FR5994
In the third installment of this six-part smart sensing series, I would like to discuss the use of ultrasonic technology in condition monitoring.
Condition monitoring is a major component of predictive or proactive maintenance. It is the process of monitoring the operating conditions of a mechanical or electrical system by detecting important changes in the behavior of equipment to prevent failure. Condition monitoring addresses conditions that would shorten equipment lifespans.
There are many techniques for condition monitoring. Ultrasound is a widely used technology. An ultrasonic sensor detects sound pressure waves, usually in the 20kHz-100kHz frequency range. Many “defective symptoms” generate a sound wave in this frequency range. A defective symptom may be as simple as an increase in friction from poor lubrication. Another symptom may be the rubbing and skidding of rolling elements against a bearing raceway, or an impact caused by mechanical flaws or contaminated lubricant. Friction in high- and slow-speed mechanical applications and leaks within high-pressure fluid situations all generate sound waves in ultrasonic frequencies. Electric arcing, tracking and corona discharges produce ionization, which disturbs the surrounding air molecules that emit ultrasonic sound waves. The frequency and amplitude of ultrasonic emissions depend on the type of equipment.
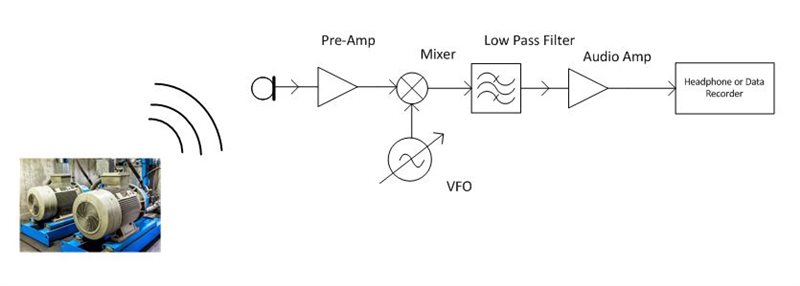
Figure 1 is a simplified functional block diagram of a typical ultrasonic detector.
 Figure 1 Functional Block Diagram of an
Ultrasonic Detector
Figure 1 Functional Block Diagram of an
Ultrasonic DetectorSince the ultrasonic wavelength is very short, a microphone or transducer can be pointed to the spot of potential emission. The microphone converts ultrasonic sound emissions to an electric signal. A mixer shifts the frequency of the electric signal down to audible frequencies. The frequency of the local oscillator is adjustable. An inspector has to tune the detector frequency to match the ultrasonic emission in order to convert it to an audible signal, much like tuning a radio. The inspector listens to the audible signal via the headphones. The audible signal can also be recorded and analyzed through spectral analysis software for a more accurate diagnosis.
Mounting ultrasonic detectors remotely on test points enables the monitoring of equipment over time and/or remotely. In many industrial applications, the 4mA-20mA current loop transmits data over a long cable; Figure 2 illustrates a typical loop. The loop comprises four individual elements: a sensor/transducer, voltage-to-current converter (commonly known as a transmitter and/or signal conditioner), loop power supply and receiver/monitor. In many applications, the sensor and voltage-to-current converter are in the same package. Sensors provide an output voltage whose value represents the physical parameter being measured. The transmitter amplifies and conditions the sensor’s output and converts the voltage to a proportional 4mA-20mA DC current that circulates within the closed loop. The receiver/monitor converts the 4mA-20mA current back into a voltage for further processing and/or display. Typically, the current loop also powers the sensor. For a 4mA-20mA current loop to work correctly, the current assumption of the sensor is limited to 3.2mA.
 Figure 2 Functional Block Diagram of a
4mA-20mA Current Loop
Figure 2 Functional Block Diagram of a
4mA-20mA Current LoopAlthough ultrasonic emissions from electrical or mechanical equipment could be in the frequency range from 20kHz-100kHz, a traditional ultrasonic detector only gathers and processes information centered at a single frequency. This severely limits the detector’s capability to capture changes in ultrasonic emissions caused by premature mechanical and/or electrical failures. Take the example of detecting partial-charge conditions in an electrical switch or transformer to prevent damage from arching or corona discharge. The false-alarm rate must be low in order to reduce financial losses from an electrical shutdown. To accomplish this goal, the monitoring system needs to examine the entre band of ultrasonic emissions instead of those at one frequency. So I would like to discuss the operating principles and signal processing of such an ultrasonic detector.
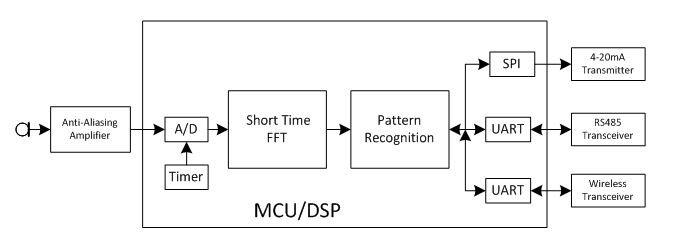
Figure 3 illustrates the functional block diagram of a conceptual ultrasonic detector.
 Figure 3 Functional Block Diagram of a
Conceptual Ultrasonic Detector
Figure 3 Functional Block Diagram of a
Conceptual Ultrasonic DetectorA wideband micro electromechanical systems (MEMS) microphone picks up the ultrasonic signal. The analog electric signal is first amplified and then low-pass-filtered for the analog-to-digital converter to properly sample. The sampling frequency should be high enough to cover the frequency range of the ultrasonic signal. To monitor the full ultrasonic bandwidth over time, I adopted the short-time fast Fourier transform (FFT) technique discussed in the first installment of this series (about glass-break detectors).
Dividing the input data into short periods enables an examination of how the signal spectrum changes over time, while an FFT algorithm calculates a spectrum for each short period. This short period must be long enough to cover the lowest frequency of interest, but not so long that the signal in the period is statistically “stationary.” An example of the spectrum computed by short-time FFT over time is illustrated in Figure 2 in the glass-break detectors blog.
With this data, you can examine the wide band of ultrasonic emissions over time. The monitoring system software tracks multiple frequencies simultaneously, providing a much more complete picture of equipment operation, enhancing detection probability and reducing the false-alarm rate. There is no longer a need for an inspector to tune the frequency.
The sensor can still use the traditional one-way 4mA-20mA current loop to pass out the status data to the centrol computer. Faster two way interfaces such as RS-485 or wireless may be required to handle data logging and sensor configuration.
Let me highlight how you could use TI’s MSP430FR5994 controller as an implementation platform for such a system:
- To cover the typical 20kHz-100kHz ultrasonic frequency range, the analog-to-digital sample frequency needs to be as high as 200kHz. The MSP430FR5994 on-chip 12-bit analog-to-digital converter (ADC) can run at 200KSPS to support this application. The MSP430FR5994 direct memory access (DMA) controller can move data from the ADC to memory without central processing unit (CPU) intervention, notifying the CPU to process after transferring a predefined block of data.
- To detect changes in sound emissions over time, you can use the short-time FFT technique, the same technique used for a glass-break detector.
- If 512 input samples are collected by the A/D converter over 2.5ms interval, a 512-point real FFT will generate a spectrum up to 100kHz with a 400Hz resolution. As I discussed in the glass-break detector post, it takes the low energy accelerator (LEA) module only about 1ms for the 512 real-point FFT when running at 16MHz. You will need an additional 0.5ms of LEA time and 0.5ms of CPU time for the overheads of data movement and windowing.
- If the application requires continuous detection, there will be 1ms of LEA time and 2ms of CPU time to examine the spectrum during each short period. The LEA consumes 67µA/MHz; the CPU consumes 100µA/MHz. The MSP430FR5994 consumes about 2.7mA when running at 16MHz with a 100% duty cycle. It is within the limit required by the 4mA-20mA loop. If an application requires measurements every 25ms, the average current consumption will be less than 300µA.
- There are many ways to examine the shot-time FFT output, including a neural network. Since the goal is to detect a significant change, the algorithm should be straightforward. The MSP430FR5994 MCU has 256KB of ferroelectric random access memory (FRAM) with fast read-and-write capability, simplifying the implementation and training of the neural network.
In the blog, we briefly discussed the use of the ultrasound technology in the conditional monitoring applications and a concept which could improve detection probability and false alarm rate. . We also discussed the feasibility of an implementation using TI’s MSP430FR5994 MCU from performance and power consumption perspectives. Do those discussions provide useful information for your design?
Additional Resources
- Learn more about the use of ultrasound in condition monitoring:
- Learn more about 4mA-20mA current loop communication:
- Learn about time-variant signal processing: