SSZTBP0 January 2016 TAS2555
Making transducers sound as natural as possible is quite a challenge for audio tuners. While subjective evaluations help designers fine-tune sound, they face several challenges, such as visual cues impacting both audio perception and quality.
Objective measurements help mitigate some of the challenges posed by subjective evaluation. Objective evaluations also help when making A/B comparisons. When conducting objective or subjective tests, audio tuners prefer high-quality audio recordings over highly compressed MP3/AAC files. Raw WAV files are the best.
To perform objective analyses, you need a good-quality microphone; an audio sound card to capture the microphone data to your PC; and software tools like MATLAB, Audacity and Room EQ Wizard (REW).
Figure 1 depicts an experimental setup using the TAS2555 audio amplifier, a TI SmartAmp.
 Figure 1 Typical Lab Setup for Audio
Measurements
Figure 1 Typical Lab Setup for Audio
MeasurementsThese are some of the objective parameters that can help audio tuners judge the perception of audio loudness and quality.
Loudness
One of the main objectives of TI’s TAS2555 is to drive the speaker to its maximum limits while protecting it against electrical or mechanical failures. The peak and average sound pressure level (SPL) measurements help determine this objectively.
I use REW for an analysis like the one shown in Figure 2, which also uses the TAS2555 audio amplifier to analyze a popular rock song.
 Figure 2 SPL Measurements
Timbre
It is imperative that while your solution should sound as loud as possible, it should not be at the expense of audio quality/timbre.
| Subjective | Objctive |
|---|---|
| Tonal character, usually pitched | Periodic sound |
| Noisy with or without some tonal character, including rustle noise | Noise, including random pulses characterized by the rustle time (the mean interval between pulses) |
| Coloration | Spectral envelope |
| Beginning/ending | Physical rise and delay time |
| Coloration glide or formant glide | Change of spectral envelope |
| Micro-intonation | Small change (one up and down) in frequency |
| Vibrato | Frequency lodulation |
| Tremolo | Amplitude modulation |
| Attack | Prefix |
| Final sound | Suffix |
The subjective analysis is objectively possible by studying the tracks (the input being the raw file/audio captured from the reference system vs. the output being speaker audio captured via mic) with these parameters:
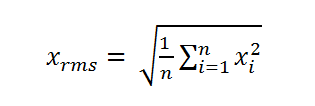
- Global energy. You can compute the global energy of signal x simply by taking the root average of the square of the amplitude, also called root-mean-square (RMS) (Equation 1). In case of an A/B comparison, where the aim is to match the two solutions, the difference between the global energy of the two solutions should be as close as possible to zero.
- Key strength. Key strength in a given musical score is extractable through cross-correlation against the distribution of energy along the various pitches. If the speaker maintains the tonality of the music well, then the key strength estimated in the input file should match that of the file recorded using the mic that captured the speaker output.
- Audio brightness. The brightness parameter indicates the evolution of brightness throughout a piece of music. High values indicate moments in the music where most of the sound energy is on the high-frequency content, whereas low values indicate moments where most of the sound energy is on the low-frequency content.
- Energy roll-off. One way to estimate the amount of high frequency in a signal is finding the corner frequency below which a certain fraction of the total energy is contained. The lower the value returned, the darker the content, or the smart amplifier has been able to preserve the low and mid frequencies well.
- Audio roughness. The roughness indicates the amount of sensory dissonance at each successive moment throughout a piece of music. The sensory dissonance corresponds to a “beating” phenomenon, where several sounds are heard with nearly the same frequency but with just a few hertz difference. Higher roughness makes the sound feel harsher.
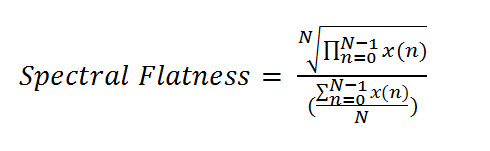
- Audio flatness. Spectral flatness, also known as Wiener entropy, is a measure used to characterize an audio spectrum. Spectral flatness provides a way to quantify how noise-like a sound is, as opposed to being tone-like. The meaning of tonal in this context is in the sense of the amount of peaks or resonant structure in a power spectrum, as opposed to the flat spectrum of a white noise. You can calculate spectral flatness by dividing the geometric mean of the power spectrum by the arithmetic mean of the power spectrum (Equation 2).
I used the TAS2555 as my example because it can use PurePath™ Console software, which helps you tune the solution to meet your signature sound. PurePath™ Console software is an easy-to-use audio-development suite that helps you evaluate, configure and debug audio products during development. Access to PurePath™ Console software enables you to identify issues and ensure the best possible sound.
TAS2555 vs Coventional Solution
Table 2 lists the average values of timbre parameters for measurement across 18 different tracks from various music genres (blues, rock, classical).
| Timbre | Popular Phone | TAS2555 | Result |
|---|---|---|---|
| Average loudness | 91.3dB | 93.6dB | 2dB higher loudness |
| Brightness | 0.690 | 0699 | Preserves high-frequency content |
| Roll-off (85%) | 7113 Hz | 6453 Hz | Preserves low- and mid-frequency content |
| Roughness | 0.472 | 0.485 | Sensory dissonance is comparable |
| Flatness | 0.314 | 0282 | Audio sounds more tonal |
Tuning an audio solution to get the most natural sound possible is often hard and takes a lot of time. There are several tools out there to help with this process; however, it is important to make sure that you account for (and correct if needed) the elements of sound that I’ve covered in this post. If you have had similar problems in the past, please leave a comment below. How do you fine-tune your sound?
Additional Resources
- Read my colleague Russell Crane’s blog about PurePath™ Console software.
- Check out TI’s Audio Selection Tool to find the right product for your needs.
- Check out our other audio blogs.