SSZTCL9 june 2015 CSD86350Q5D
Many elements go in to making excellent efficiency measurements in power supplies, but let’s concentrate here on temperature stabilization. Other concerns include quality and calibration of measurements and shunts. As efficiency requires two voltage and two current measurements, errors from the voltage and current meters used can stack up. With the best handheld meters (about $400 each) and diligent calibration, this “stack up” can be limited to about 1% in overall error. That error can be cut to be about 0.1% with higher-quality bench instruments and well calibrated shunts.
Resistivity of both copper and silicon increase about 10% per 25° C. Conduction losses are proportional to resistivity and account for over half of total losses in most power supplies. If you can get in the measurement well before the material heats up, you can get a better efficiency reading. But how much better?
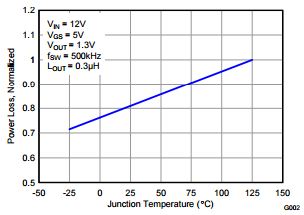
 Figure 1 Normalized Power Loss versus
Temperature in the CSD86350Q5D
 Figure 1 shows a graph of losses versus temperature in CSD86350Q5D, a power stage similar to the one used in the power supply that I tested below. For each 25° C increase, losses increase about 5-6%. For inductors with combined DC, AC and core losses, a similar loss versus temperature relationship exists. For power supplies with efficiencies of about 90%, this 5-6% loss increase corresponds to about a .5% reduction in efficiency.
Our Power Design Services group has an automated efficiency tester for power supplies using a programmable source, a programmable load, four high-precision meters (Agilent 34401A), two calibrated shunts and a LabVIEW program to step the source load and collect the data. One concern I had was that data was being collected before the power supply had a chance to stabilize at a given load, thereby giving false efficiency readings. I decided to do some tests with the setup and vary the sequences and delays to see how much error was actually being introduced.
I used a convection-cooled (no fan) 12V to 1.2V TIDA-00324 design on a 6-inch x 6-inch board with a 50° C steady-state max temperature rise at 90A to serve as a near “worst-case” situation, so that premature readings would give false higher efficiencies. This is because larger boards have greater thermal time constants than smaller boards, and convection-cooled supplies take longer to stabilize than forced air-cooled supplies. Also, the greater the final temperature rise, the longer it takes to stabilize, and the greater potential for error. Designs more than 50°C that rise at the rated full load are generally not considered reliable.
I initially conducted three runs. The first was with the power-supply run at full load until stabilization, with data taken in 5A increments stepping down from a full 90A load to no load with 96 seconds between readings. This test took 30 minutes after stabilization and is the most “conservative” approach; with errors (if any) are efficiency readings that are too low.
The second run was a typical run on our setup where a cold supply is started up at no load and step-loaded in 5A increments to 90A. The only delay between readings is the measurement delay of the program, which turns out to be about 6 seconds per reading. This delay, coupled with the desire to get lots of readings, will be what actually significantly reduces error.
The third run was done to maximize “cheating” or measured efficiency at full load, where a cold supply is started up at full load (I took an initial reading) and then the load is stepped down in 5A increments.
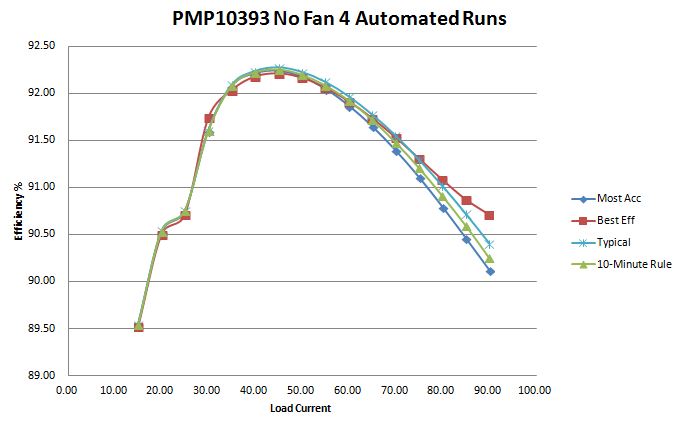
Here are the results. I’ll discuss the “10-Minute Rule” plot referenced in Figure 2 later.
 Figure 2 Efficiency versus Load in the
PMP10393, No Fan, Four Measurement
Methods
Figure 2 Efficiency versus Load in the
PMP10393, No Fan, Four Measurement
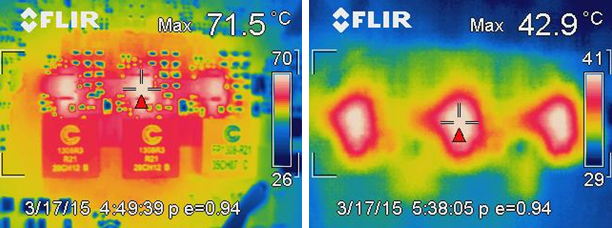
MethodsAs expected, errors are greatest at max load with efficiency reported 0.3% high in the typical case and 0.6% high where I tried to “cheat” the most. I also took thermal images of the board when reaching stabilization and when I got that 0.6% high efficiency reading (Figure 3).
 Figure 3 PMP10393 At 90A No Fan: Steady State and
after Only 6 Seconds at Full Load
Figure 3 PMP10393 At 90A No Fan: Steady State and
after Only 6 Seconds at Full LoadThere is about a 29° C difference. The 0.6% reduction in efficiency at steady state corresponds to a 7.3% increase in losses. This is consistent with a 5-6% increase in losses per 25°C.
The 0.3% error in the typical measurement method has to be compared against other possible errors in the measurements. If the meters are handheld and will cause about a 1% overall error, then this 0.3% is not a dominant issue. However, compared with a 0.1% error with high-grade bench instruments, this 0.3% is definitely significant.
Taking about 20 minutes for full stabilization and then slowly reducing the load will give the most reliable measurements.. I observed that if the power supply is run steadily for 4-5 minutes at full load, the efficiency readings will be within 0.1% of the final 90.12% value. With the average load being about one-half of the full load during a linear ramp-up to full load, I reasoned that by spreading the ramp-up over twice this 5 minutes for 10 minutes in all, will yield about the same accuracy.
I then went back to the typical setup where a cold supply is started up at no load and step-loaded in 5A increments to 90A, but added a measurement delay of 25 seconds per reading to get the full 90A load after 10 minutes. Spreading measurements evenly over time to reach full load after 10 minutes is what I will call the “10-Minute Rule” The 10-Minute Rule plot in Figure 2 is the result of this approach. Max error was less than 0.14%, which is less than the calibration error of a single Fluke 87V meter current measurement.
With a fan, I increased the max load to 120A to get the same 50° C rise in steady state at full load. Here, I was able to implement the “5-Minute Rule” to ramp from no load to the full 120A load in 5A increments over 5 minutes instead of 10 minutes. The error of the 120A efficiency reading at the end of 5 minutes was 0.13% (88.34% versus 88.21% steady-state efficiency). Hence, a 5-minute rule with forced-air applications will yield similar accuracy to a 10-minute rule in applications without a fan.
Because I performed my tests on a 6-inch x 6-inch board with a 50°C max full-load temperature rise in steady state, I would expect designs with smaller boards and lower max temperature rises to have less error, using the same 10-minute rule for applications without fan and the 5-minute rule for forced-air applications.
In summary, running power supplies on an automated efficiency tester setup as they are typically run with load gradually incremented from zero to full load, but with adding delays to target an overall 5 minutes test in the case of fan cooled power supplies and 10 minutes in the case of no fan will reduce errors due to temperature stabilization to 0.1% or less.