SSZTCR2 may 2015 TPS53318 , TPS53319 , TPS53355
Control-loop gain, which can be plotted in a Bode plot, is a good indicator of system stability. Control-loop bandwidth also directly affects transient response performance.
DCAP™ or DCAP2™ /DCAP3™ regulators (which I’ll refer to as DCAPx in this discussion) became popular for their simplicity. The DCAPx poses a challenge for engineers when it comes to measuring control-loop gain. It is tempting to measure the Bode plot by breaking the loop at the top of the feedback resistor divider as shown in Figure 1. This is proper for traditional control architectures where there is only one output feedback path and the feedback goes through the compensator before pulse-width modulation (PWM).
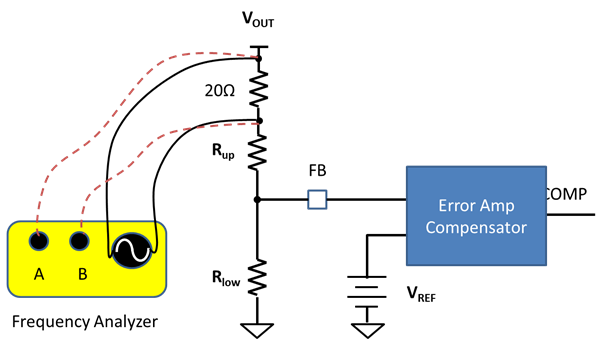 Figure 1 Conventional control-loop gain
setup
Figure 1 Conventional control-loop gain
setupRather than the traditional voltage-mode or current-mode control architectures, the DCAPx control system has two direct output feedback paths: one through the feedback resistor divider network, and the other through the direct current resistance (DCR) injection circuit, as shown in Figure 2. The DCAPx control system does not have a high DC gain error amplifier like the traditional type II or type III compensator. PWM pulses are modulated at the FB pin. The FB pin is usually the negative input of the error amplifier for traditional control architectures. For DCAP, DCAP2, DCAP3, it is one of the input of the PWM comparator.
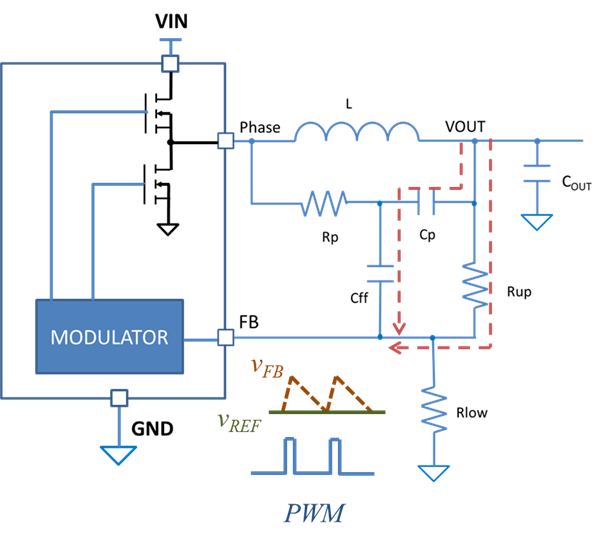 Figure 2 Block diagram of a DCAP
regulator with a DCR injection circuit
Figure 2 Block diagram of a DCAP
regulator with a DCR injection circuitBy leaving one of the feedback path outputs of the measurement, the Bode plot measured using the setup shown in Figure 1 does not directly correlate to the transient response. To properly measure the loop-gain Bode plot, the loop breaking point should include both feedback paths, as shown in Figure 3.
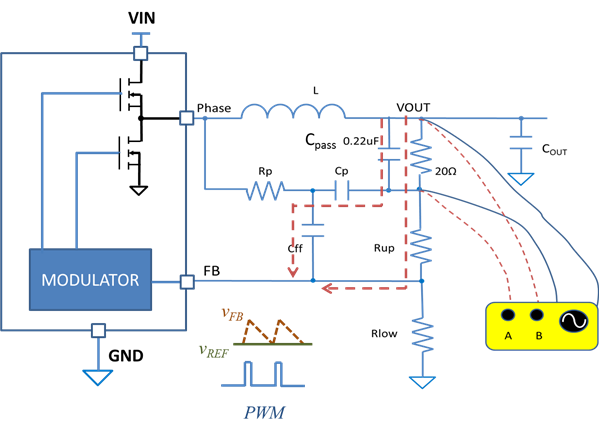 Figure 3 Proper DCAP regulator
control-loop Bode plot measurement setup
Figure 3 Proper DCAP regulator
control-loop Bode plot measurement setupFor DCAPx regulators, the PWM modulation gain is determined by the falling slope of the triangular waveform formed at the FB pin by the DCR injection network and output-capacitor equivalent series resistance (ESR). The parasitic inductance and resistance along the disturbance-injection cable and noise coupled into the wires would tort the triangular waveform at the FB pin, thus rendering a different PWM modulation gain than that of the regulator without the test setup.
To preserve accuracy, a bypassing capacitor, Cpass, is added in parallel to the 20Ω resistor. The 20Ω resistor and Cpass form a high-pass filter. The corner frequency is set at lower than half of the converter switching frequency so that the triangular waveform at the FB pin during the testing remains similar to that during normal operation.
I used 0.22µF for a converter switching at 500KHz. For most applications, the proper Cpass value is from 0.1µF to 0.47µF. To minimize the effect on the system, the DCR injection capacitor, Cp, should be less than one-tenth of Cpass, as shown in Figure 3.
Figure 4 shows the Bode plot measurement results using the test setup shown in Figure 3. Cpass = 0.22µF and Cp = 22nF. By adjusting Rp and Cff, crossover frequency is set at one-sixth the switching frequency with a phase margin of 66 degrees. I conducted these experiments with the reference design, Step-down converter for powering rails in Altera Arria V FPGA (PMP8824).
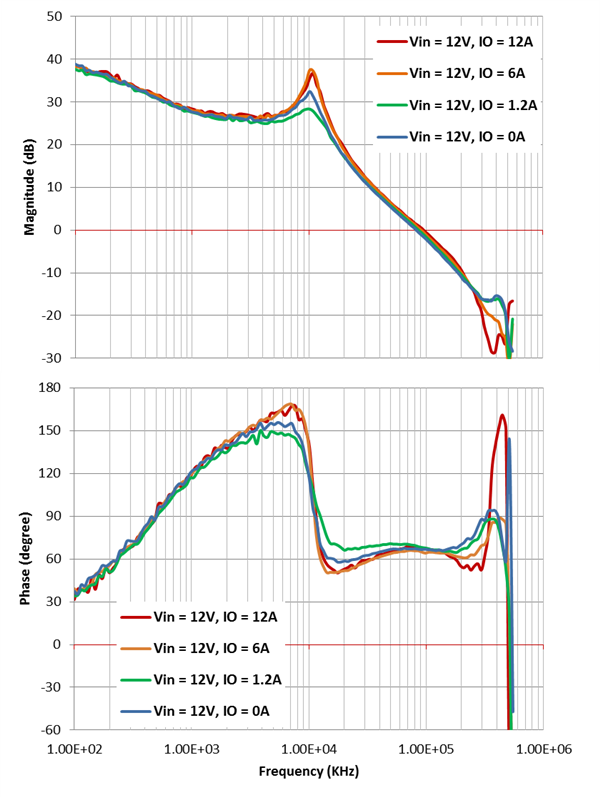 Figure 4 Bode plots measured with the
proposed test setup on the TPS53319 with DCR injection (Vout =
1.2V)
Figure 4 Bode plots measured with the
proposed test setup on the TPS53319 with DCR injection (Vout =
1.2V)Figure 5 shows the corresponding transient response at load step-up and step-down. I also conducted these experiments with the PMP8824.
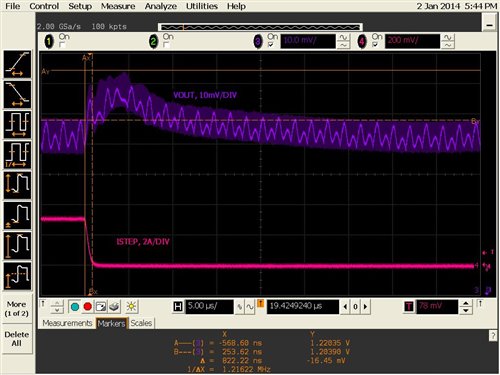
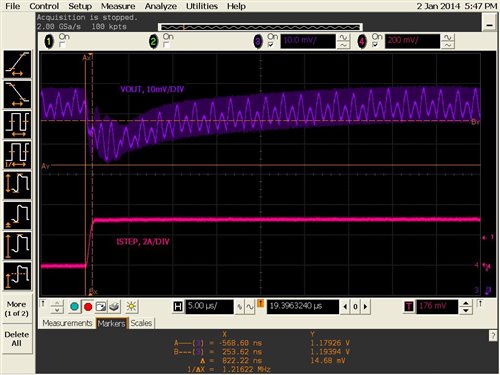 Figure 5 Load transient response of the
TPS53319 (Vout = 1.2V)
Figure 5 Load transient response of the
TPS53319 (Vout = 1.2V)For DCAP2 and DCAP3 control systems, the DCR injection circuit is integrated inside the silicon. The same technique is applicable. Figure 6 shows the loop Bode plot test setup for DCAP2 and DCAP3 regulators.
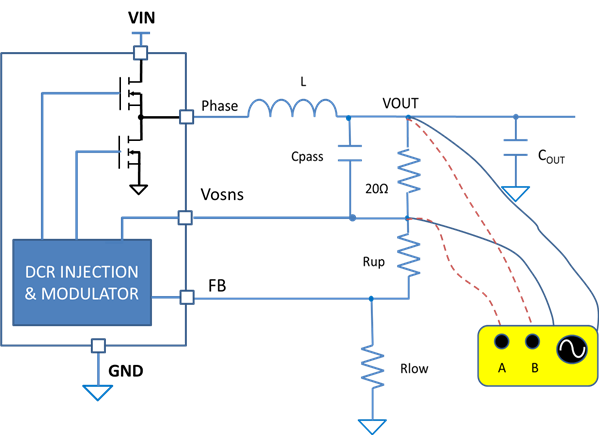 Figure 6 Proper DCAP2 and DCAP3
regulator control-loop Bode plot measurement setup
Figure 6 Proper DCAP2 and DCAP3
regulator control-loop Bode plot measurement setupBode plots are measurable for DCAP, or DCAP2/DCAP3 regulators. With the technique provided in the previous discussion, Bode plots can be measured to assure system stability and to serve a guideline to optimize transient performance.