TIDT237 December   2022 TPS73801-SEP


  1.   Description
  2.   Features
  3.   Applications
  4. 1Test Prerequisites
    1. 1.1 Voltage and Current Requirements
  5. 2Testing and Results
    1. 2.1 Voltage Regulation
    2. 2.2 Efficiency Graphs
    3. 2.3 Thermal Images
    4. 2.4 Bode Plots
  6. 3Waveforms
    1. 3.1 Output Voltage Ripple
    2. 3.2 Current Limit
    3. 3.3 Load Transients
    4. 3.4 Start-up and Shutdown
    5. 3.5 Thermal Shutdown

Thermal Images

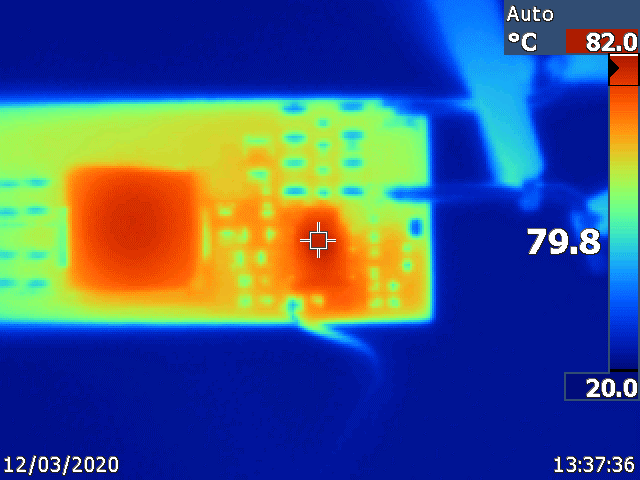
The following thermal images are at steady state with an input voltage of 16 V and a load of 2.1 A. There is no airflow and ambient is at room temperature.
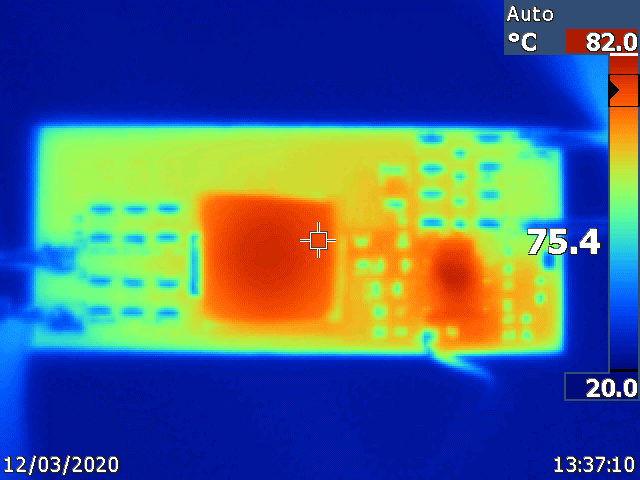
GUID-20210708-CA0I-N8NF-CQSB-04QBX6VQCNKM-low.png Figure 2-13 Full Board
GUID-20210708-CA0I-P9GD-3FPG-CPWCN1RF3Z05-low.png Figure 2-14 IC Peak Temperature (79.8°C)
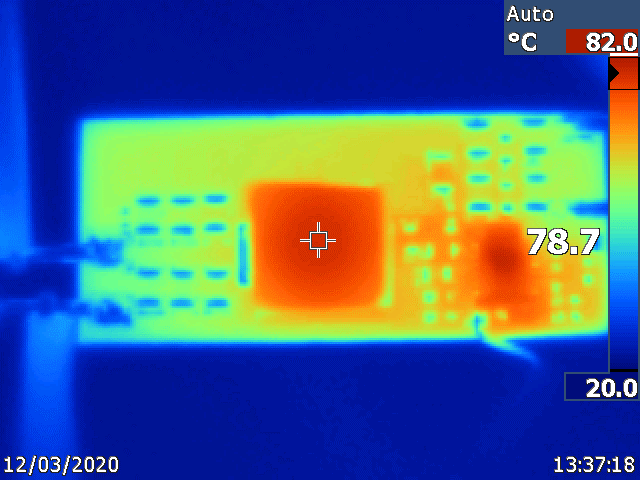
GUID-20210708-CA0I-QBRL-GJPX-806VKLNP40H4-low.png Figure 2-15 Inductor Peak Temperature (78.7°C)