TIDT243 December 2021
5.1 Conducted Emissions – Test Results
Figure 5-3 and Figure 5-4 illustrate the low- and high-frequency range scopes for part A.
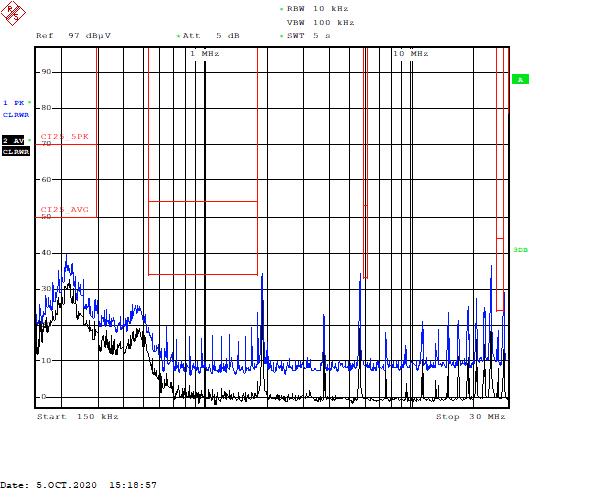 Figure 5-3 Part A – Low-Frequency Range
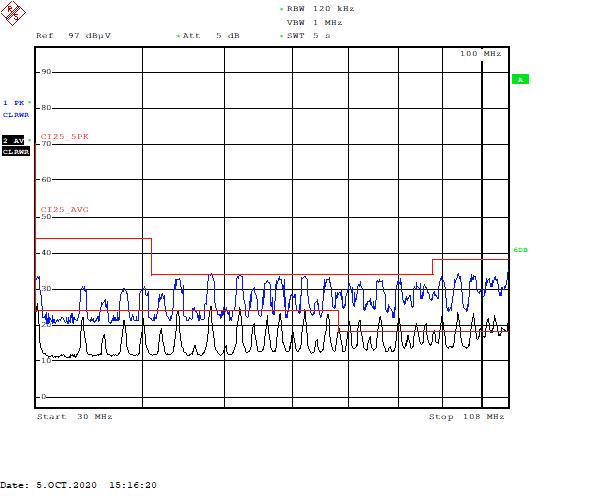 Figure 5-4 Part A – High-Frequency Range
Figure 5-5 and Figure 5-6 illustrate the low- and high-frequency range scopes for part B.
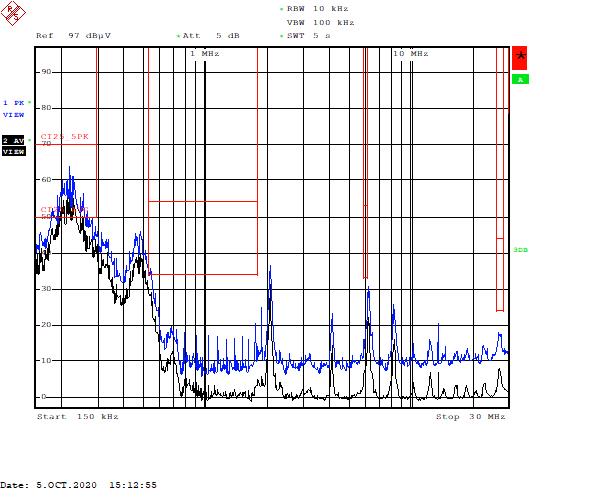 Figure 5-5 Part B – Low-Frequency Range
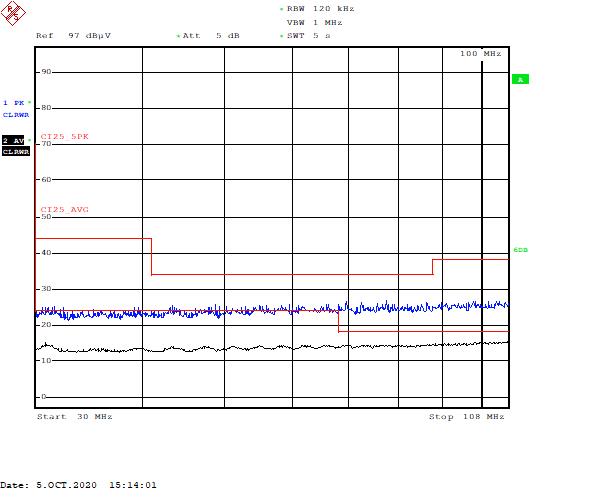 Figure 5-6 Part B – High-Frequency Range
Figure 5-7 through Figure 5-10 illustrate the low- and high-frequency range scopes for part C.
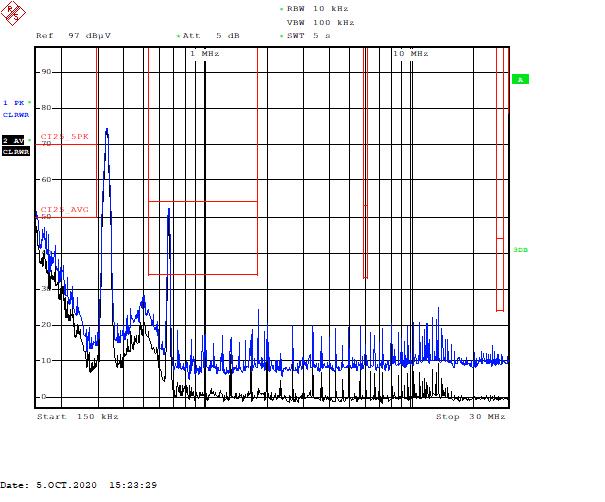 Figure 5-7 Part C – Low-Frequency Range, 400 kHz
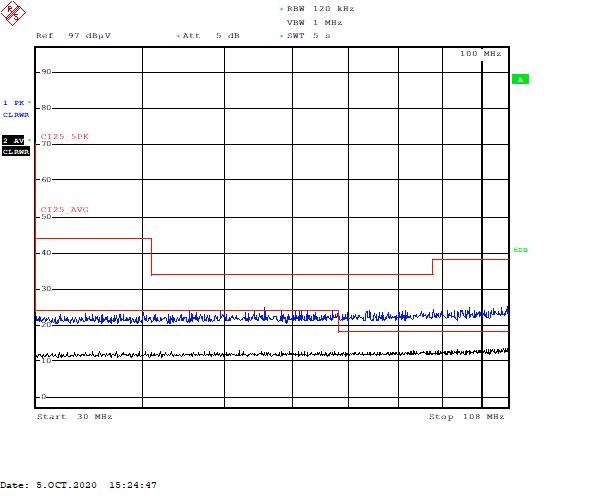 Figure 5-8 Part C – Low-Frequency Range, 400 kHz
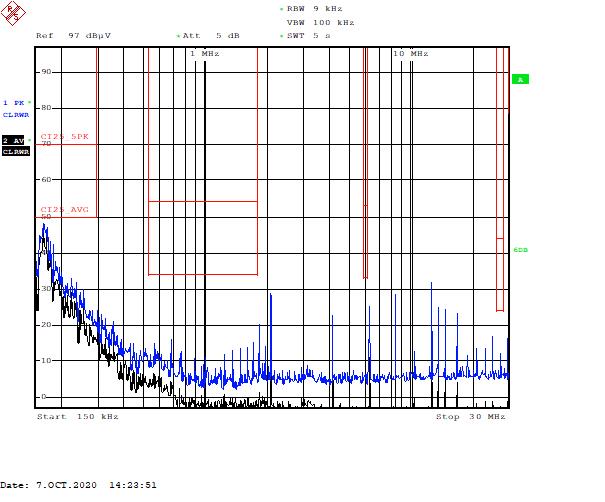 Figure 5-9 Part C – Low-Frequency Range, 400 kHz
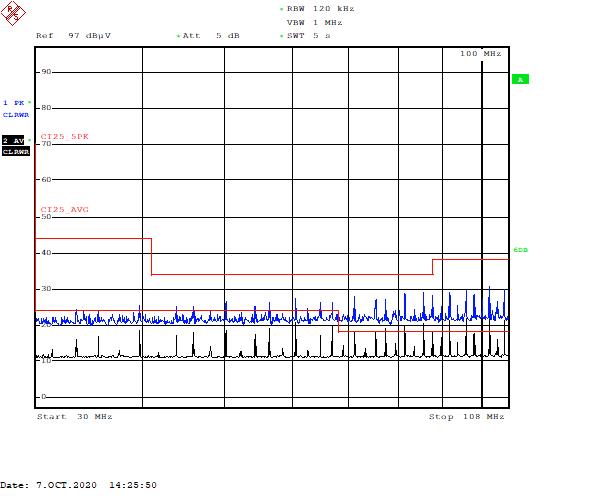 Figure 5-10 Part C – High-Frequency Range, 2.1 MHz