TIDUA71 January 2022
3.2.1 Class-H Tracking Waveform Example
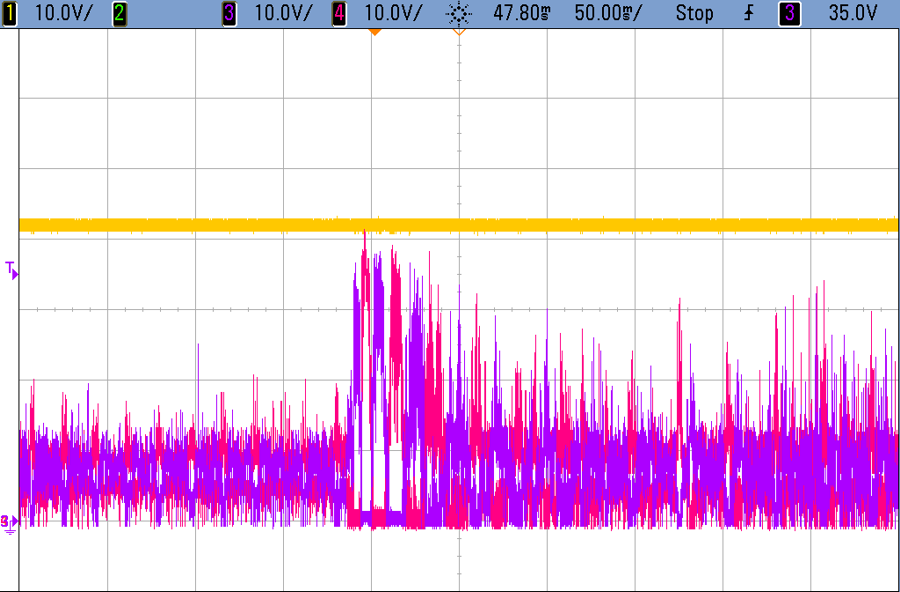
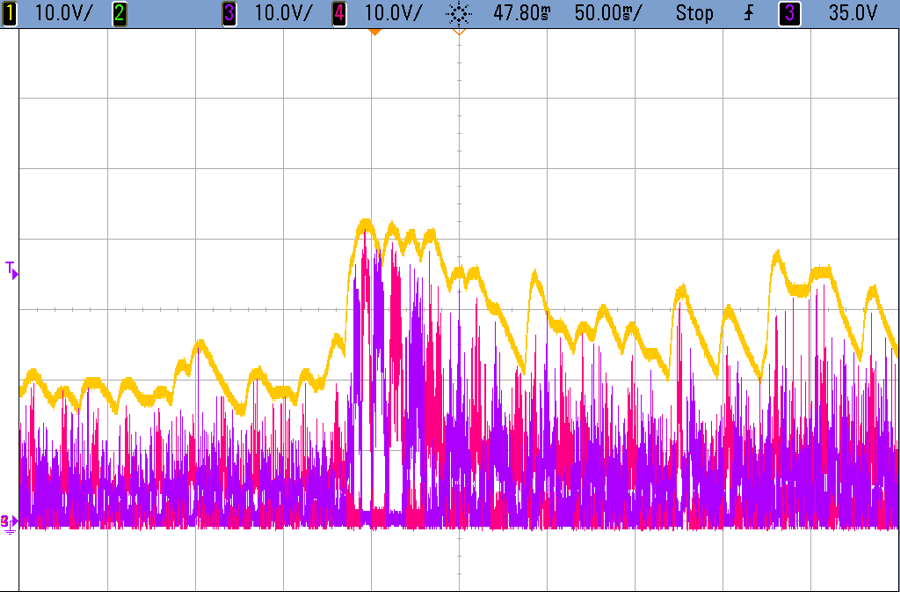
Figure 3-1 and Figure 3-2 show examples of the output of the LM5123-Q1 with and without the envelope tracking software running in the TAS6584-Q1. When disabled, the output of the boost is set to a constant 42 V to allow for a maximum output power of about 120 W into an 8-Ω load. When enabled, the output voltage will follow the envelope of the audio waveform and can vary anywhere from 15 V to 42 V.
 Figure 3-1 Audio Output and Boost
Voltage Without Class-H Operation
 Figure 3-2 Audio Output and Boost
Voltage With Class-H Operation