SWRA446 February 2015 CC1310 , CC1310 , CC2620 , CC2620 , CC2630 , CC2630 , CC2640 , CC2640 , CC2640R2F , CC2640R2F , CC2640R2F-Q1 , CC2640R2F-Q1 , CC2650 , CC2650 , CC2650MODA , CC2650MODA
7.3 Configure Eclipse Debugger
This section describes how to configure the Eclipse debugger.
- In the Project Explorer, right click blink_led and select Debug As → Debug Configurations… The Debug Configurations window will now be shown.
- Right click 'GDB Hardware Debugging' and select 'New'.
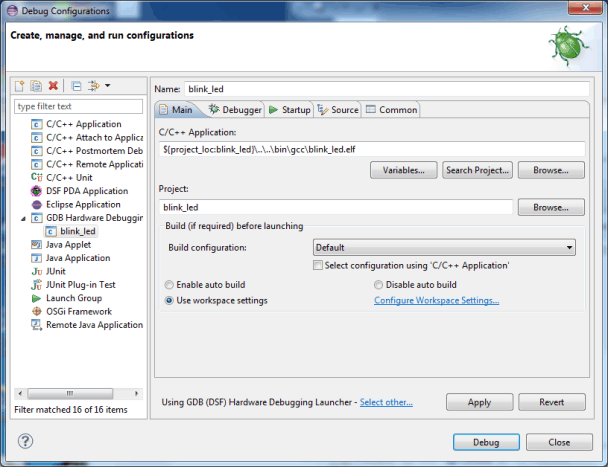
- Make sure that the settings in the 'Main' tab are configured as in Figure 22.
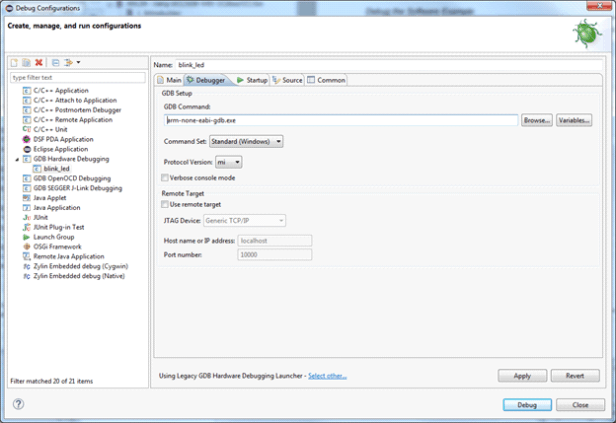
- Select the 'Debugger' tab. Make sure the 'Use remote target' box is unchecked. In the GDB command field type in:
- Windows: arm-none-eabi-gdb.exe
- Linux: arm-none-eabi-gdb
NOTE
For Linux: In some cases an absolute path to gdb must be used for Eclipse to be able to find it. Use the full path to arm-none-eabi-gdb. This program is found in the bin folder where GNU Tools for Arm Embedded Processors is installed.
- At the bottom of the window where the text 'Using GDB (DSF) Hardware Debugging Launcher' is shown, press 'Select other….Mark the checkbox 'Use configuration specific settings' and select the 'Legacy GDB Hardware Debugging Launcher'.
- Select the 'Debugger' tab again. The settings should look like the ones shown in Figure 23.
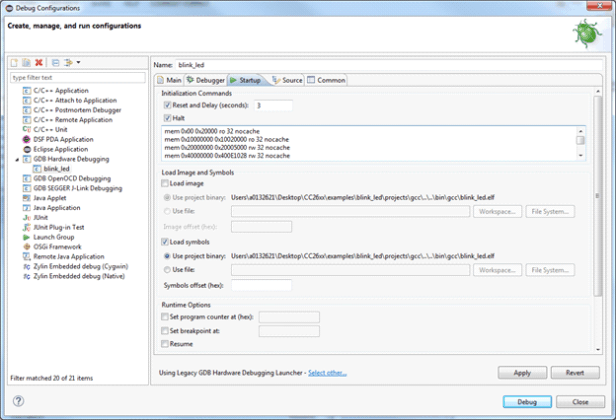
- Select the ‘Startup’ tab and configure the same setting as shown in Figure 24. Make sure that Load image is unchecked, and that the following commands are added in the Initialization Commands window:
- Click 'Apply' and close the 'Debug Configurations' window.
 Figure 22. GDB Hardware Debugging – Main Tab
  Figure 23. GDB Hardware Debugging – Debugger Tab
 mem 0x00 0x20000 ro 32 nocache
mem 0x10000000 0x10020000 ro 32 nocache
mem 0x20000000 0x20005000 rw 32 nocache
mem 0x40000000 0x400E1028 rw 32 nocache
mem 0xE000E000 0xE000F000 rw 32 nocache
target remote localhost:55000
The mem command defines the specified memory regions with different attributes.
ro: read only
rw: read write
32: use 32 bit memory access
nocache: disable GDB from caching target memory
The target remote localhost:55000 will make the GDB to connect to the gdbserver on the local pc using port 55000.
 Figure 24. GDB Hardware Debugging – Startup Tab