SWRA446 February   2015 CC1310 , CC1310 , CC2620 , CC2620 , CC2630 , CC2630 , CC2640 , CC2640 , CC2640R2F , CC2640R2F , CC2640R2F-Q1 , CC2640R2F-Q1 , CC2650 , CC2650 , CC2650MODA , CC2650MODA


  1.   Using GCC/GDB With SimpleLink CC26xx/CC13xx
    1.     Trademarks
    2. 1 Introduction
    3. 2 Prerequisites
      1. 2.1 Platforms
      2. 2.2 Hardware
      3. 2.3 Software
    4. 3 Hardware Setup
    5. 4 Software Installation Instructions
      1. 4.1 Java Runtime Environment
      2. 4.2 Eclipse IDE (Windows)
      3. 4.3 Eclipse IDE (Linux)
      4. 4.4 GNU Toolchain (Windows)
      5. 4.5 GNU Toolchain (Linux)
      6. 4.6 Build Tools for Windows
      7. 4.7 TI Emupack and GDB Server (Windows)
      8. 4.8 Flash Programmer (Windows)
      9. 4.9 Flash Programmer (Linux)
    6. 5 Build the Software Example
      1. 5.1 Import Example Project Into the IDE
      2. 5.2 Build the Software Example
    7. 6 Load Binary Image to Target
      1. 6.1 Configure Flash Programmer Tool (Windows)
      2. 6.2 Configure Flash Programmer Tool (Linux)
      3. 6.3 Load the Image to Target (Windows)
      4. 6.4 Load the Image to Target (Linux)
    8. 7 Debug the Software Example
      1. 7.1 Launch the GDB Server (Windows)
      2. 7.2 Launch the GDB Server (Linux)
      3. 7.3 Configure Eclipse Debugger
      4. 7.4 Running the Software Example From Debugger
    9. 8 References
  2. AMakefile
    1. A.1 Makedefs
    2. A.2 Makefile
  3. BLinker and Startup Files
    1. B.1 Linker File
    2. B.2 Startup Files

Running the Software Example From Debugger

After the image is downloaded to the target, the debugger can be launched.

  1. Select Run → Debug Configurations, and the Debug Configurations panel will be opened.
  2. Make sure that the GDB server agent is started (as described in Section 7.1 for Windows and Section 7.2 for Linux)
  3. Select the ‘blink_led’ configuration under ‘GDB Hardware Debugging’ and press the ‘Debug’ button.
  4. The debugger connects to the target through the GDB server. The debugger prompts you to ‘Confirm Perspective Switch’. Click ‘Yes’ to switch to the Debug perspective. The execution of the application can now be controlled from the debugger in Eclipse (press F8 (or the Resume button) to start running the application).
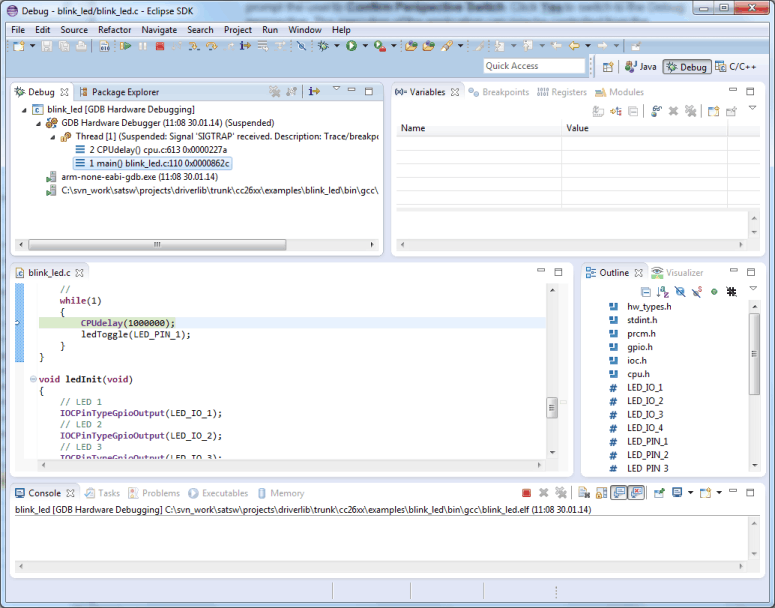
  5. running_the_software_example_swra446.gifFigure 25. Running the Software Example From Debugger