SBAA555 august 2023 AFE8092
2.6 Frequency Response Before and After Droop Correction and Limitations
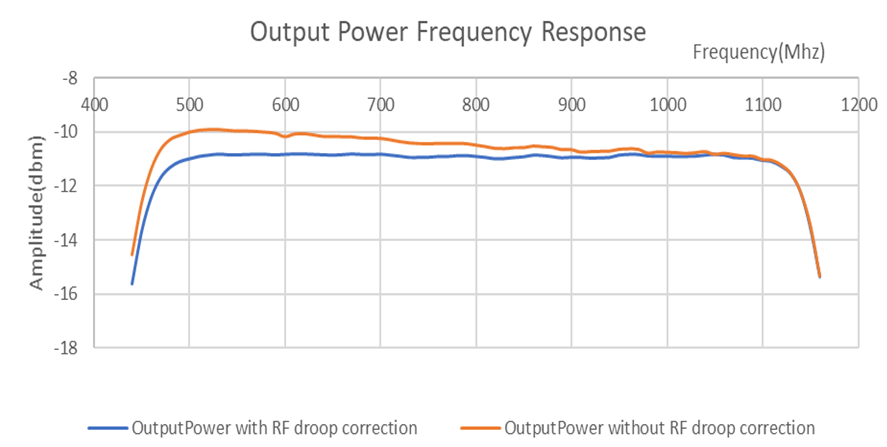
The flatness being a key factor in performance of a RF DAC was measured in TI lab. Figure 2-3 shows the actual frequency response of output power with and without RF droop correction on AFE8092. Note that the M1 and M2 measurements were taken after the matching circuit (at Meas1 position) in this case.
 Figure 2-3 Output Power Frequency
Response
Figure 2-3 Output Power Frequency
ResponseAs Figure 2-3 demonstrates without the RF droop correction, there is a droop of almost 1 dB across the bandwidth, which gets reduced substantially once RF droop correction is enabled. Note that the M1 and M2 measurements were taken at 520 MHz and 1080 MHz respectively.
The amount of Rf droop Max of (│Ac - A1│ and │Ac - A2│) that can be corrected have an upper limit. Following chart mentions the maximum Rf droop that can be corrected with respect to the ratio of ∆F to band width (Fdata).
| ∆F/ Fdata | Max of (│Ac - A1│ and │Ac - A2│) dBm |
|---|---|
| 0.1 | 0.8 dBm |
| 0.2 | 2.2 dBm |
| 0.3 | 3.3 dBm |
| 0.4 | 4.7 dBm |