SNLA416A September 2022 – February 2024 DS90UB960-Q1 , HD3SS3212-Q1
6 Margin Analysis
The TI DS90UB960-Q1 deserializer includes multiple forms of automatic adaptations to improve link reliability. One such method is the use of automatically adjusted strobe positions, which controls where data is sampled in the signal eye. Different strobe positions can be the most effective in different circumstances depending on factors such as cable length, cable quality, and temperature. The Margin Analysis Program (MAP) checks for errors and lock at combinations of the strobe positions and EQ levels to analyze the margin in the system.
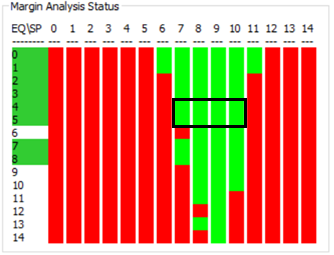
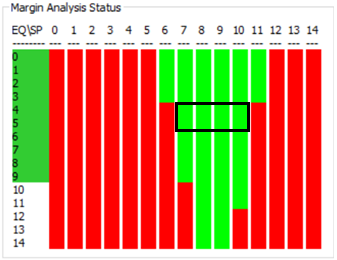
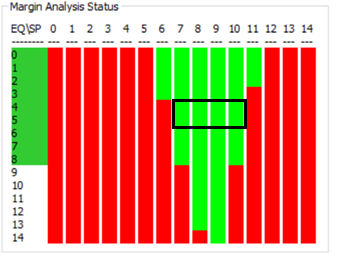
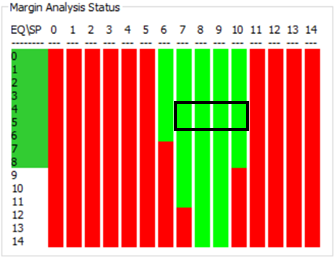
Manual strobe control is a useful tool for system evaluation, because the tool can be used to evaluate the condition of the eye with only an I2C connection. In general, this is done by creating a margin analysis plot where the status of the deserializer is monitored for each combination of EQ and strobe settings. These diagrams track lock status, parity errors, forward channel CRC errors, forward channel sequencing errors, and forward channel encoding errors over all EQ settings and strobe positions using the smaller base delay. The green squares indicate passing settings, in which the deserializer and serializer are locked with zero errors. EQ levels with at least four passing strobe positions are considered recommended EQ levels. In general, TI recommends having a margin of at least three EQ levels with four passing strobe positions, including a contiguous rectangle of passing states that measures two EQ levels by four strobe positions.
Both the non-multiplexed (Figure 6-4, Figure 6-2, Figure 6-3) and multiplexed (Figure 6-4) channels on the DS90UB960-Q1 MUX EVM have a passing margin analysis report as shown with the black rectangles. This demonstrates that the addition of the multiplexer does not significantly impact the overall channel signal integrity.
 Figure 6-1 Margin Analysis Plot - RX PORT0 (CH1)
 Figure 6-3 Margin Analysis Plot - RX PORT2 (CH3)
 Figure 6-2 Margin Analysis Plot - RX PORT1 (CH2)
 Figure 6-4 Margin Analysis Plot - MUX RX PORT3 (CH4)