SBBS002B January 1994 – June 2015 OPT101
PRODUCTION DATA.
- 1 Features
- 2 Applications
- 3 Description
- 4 Revision History
- 5 Pin Configuration and Functions
- 6 Specifications
- 7 Parameter Measurement Information
- 8 Detailed Description
- 9 Application and Implementation
- 10Power-Supply Recommendations
- 11Layout
- 12Device and Documentation Support
- 13Mechanical, Packaging, and Orderable Information
Package Options
Mechanical Data (Package|Pins)
Thermal pad, mechanical data (Package|Pins)
Orderable Information
9 Application and Implementation
NOTE
Information in the following applications sections is not part of the TI component specification, and TI does not warrant its accuracy or completeness. TI’s customers are responsible for determining suitability of components for their purposes. Customers should validate and test their design implementation to confirm system functionality.
9.1 Application Information
Figure 21 shows the basic circuit connections for the OPT101 operating with a single power supply and using the internal 1-MΩ feedback resistor for a response of 0.45 V/μW at 650 nm. Pin 3 (–V) is connected to common in this configuration. Applications with high-impedance power supplies may require decoupling capacitors located close to the device pins as shown.
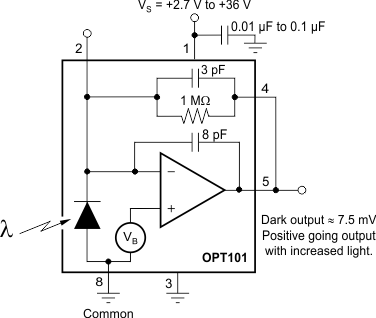 Figure 21. Basic Circuit Connections
9.2 Typical Applications
9.2.1 Color and Reflective Wavelength Tester
A common application for the OPT101 is testing physical materials. Information can be gained about a test material by determining the optical reflection, transmission, or absorption properties at particular wavelengths. These test materials can be solid objects, biological or chemical liquids, or any other type of material.
For an intuitive example, this application for OPT101 tests red, green, and blue reflective color properties of a variety of test materials. This application is not intended to match the color standards as defined by the Commission Internationale de l'Eclairage (CIE), but to illustrate a generic optical wavelength-specific test technique. Different applications can test for different wavelengths, including invisible ultraviolet or infrared wavelengths, that are appropriate for the objective of that application.
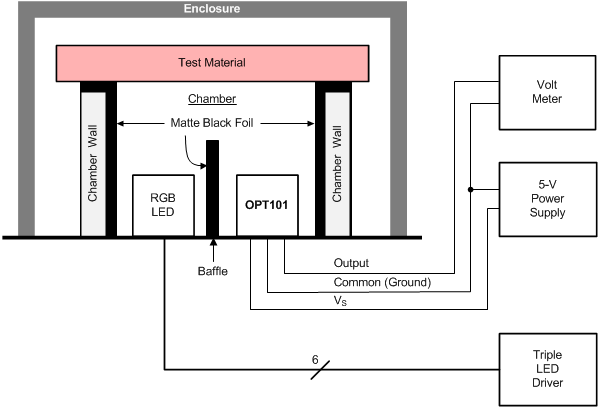 Figure 22. Fixture for Measurement of Optical Reflective Properties of a Test Material
9.2.1.1 Design Requirements
For this design example, use the parameters listed in Table 3 as the input design requirement parameters.
Table 3. Design Parameters
| DESIGN PARAMETER | VALUE |
|---|---|
| Input power supply voltage | 5 V |
| Room ambient light condition | < 2000 lux |
| Ratio of blue and green response to red response, for red target | < 60% |
| Ratio of red and green response to blue response, for blue target | < 60% |
| Ratio of red and blue response to green response, for green target | < 80% |
9.2.1.2 Detailed Design Procedure
This design illuminates a test material with specific wavelengths, and measures the resulting reflection. Choose an RGB LED that sequentially creates individual red, green, and blue wavelengths. Red material has a strong reflection of red wavelengths, and a weaker reflection of green and blue wavelengths. Green and blue materials follow a similar pattern, reflecting the respective primary color wavelengths stronger than other color wavelengths.
Design a fixture with a chamber that allows the RGB LED to illuminate the test material and allows the OPT101 to receive the resulting reflection, as shown in Figure 22. Design the chamber to keep out ambient light from the room. Line the chamber with a matte black foil so that the chamber walls absorb as much light as possible. The matte black foil helps the OPT101 sensor measure reflections primarily from the test material and only minimally from the chamber walls. Design a baffle structure between the RGB LED and the OPT101 sensor so that light does not transmit directly from the RGB LED to the OPT101 sensor without reflecting off of the test material. Place an additional enclosure over the chamber to enhance the isolation from any light in the room.
Drive the OPT101 power supply pin, VS, with a 5-V power supply, and measure the output pin voltage with a voltmeter. This voltmeter can easily be replaced with an ADC.
Choose LED drive currents for each of the RGB LEDs. Throughout this procedure, either drive each LED with this specific chosen current, or do not drive the LED at all. Choose an LED drive current that equalizes the power dissipation (the drive current times the forward-biased voltage drop across each LED). This equal power dissipation minimizes thermal transient settling time when switching between the LEDs. This equal power dissipation is not a requirement if test speed and settling time are not an issue for the application.
Calibrate the fixture by measuring a standard white card as a test material. Drive the red LED, and record the resulting voltage from the OPT101. Repeat this procedure with the green and blue LEDs.
Next, measure a test material with the same procedure used for the white card. Normalize the results by dividing the test material result by the white card result for each LED. Determine the color of the object by selecting the largest of the three LED normalized measurements. Perform an additional normalization step for data clarity by dividing each of the three LED measurements by the largest of the three measurements.
9.2.1.3 Application Curves
The following figures show that the colors of the test materials sorted properly, as expected. The red test materials all showed a stronger reflection for red LED than the green and blue LEDs. The results are plotted in four groups: red (Figure 23, blue (Figure 24), green (Figure 25), and neutral color (Figure 26). The application clearly identifies the primary color of each test material. When the color is neutral, then the red, green, and blue test results are very similar to each other, as expected (within 10% of each other).
The red results had the most contrast. The green results had the least contrast. These results are likely different because the red LED has the least spectral overlap with the green and blue LEDs. The green LED has the widest spectral content. If more contrast is required, try LEDs (or other light sources) with more-narrow spectrums.
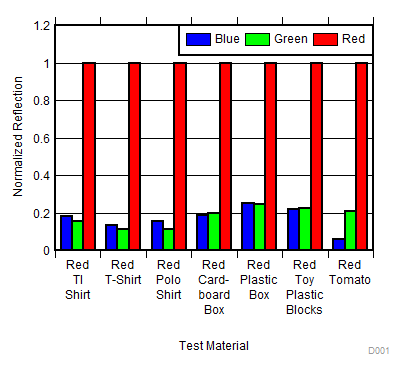 Figure 23. Normalized Reflections for Red Materials
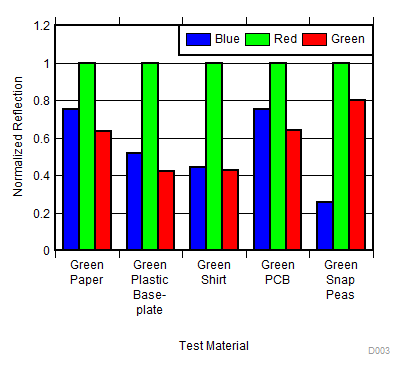 Figure 25. Normalized Reflections for Green Materials
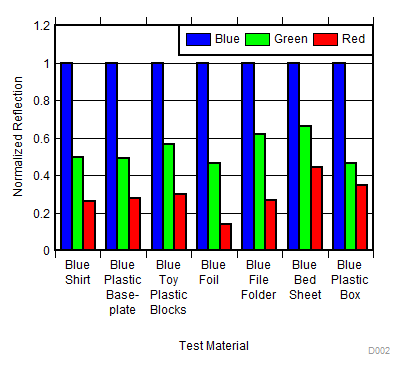 Figure 24. Normalized Reflections for Blue Materials
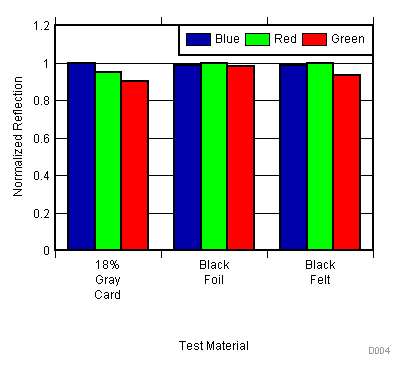 Figure 26. Normalized Reflections for Neutral Materials
9.2.2 Three-Wire Remote Light Measurement
Use the connections to the OPT101 shown on the right side of Figure 27 to sense a remote location with a three-wire light measurement circuit.
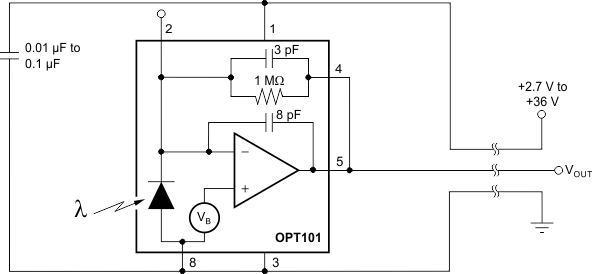 Figure 27. Three-Wire Remote Light Measurement
9.2.3 Differential Light Measurement
Use a configuration similar to Figure 28 for applications that sense light gradients or differential light.
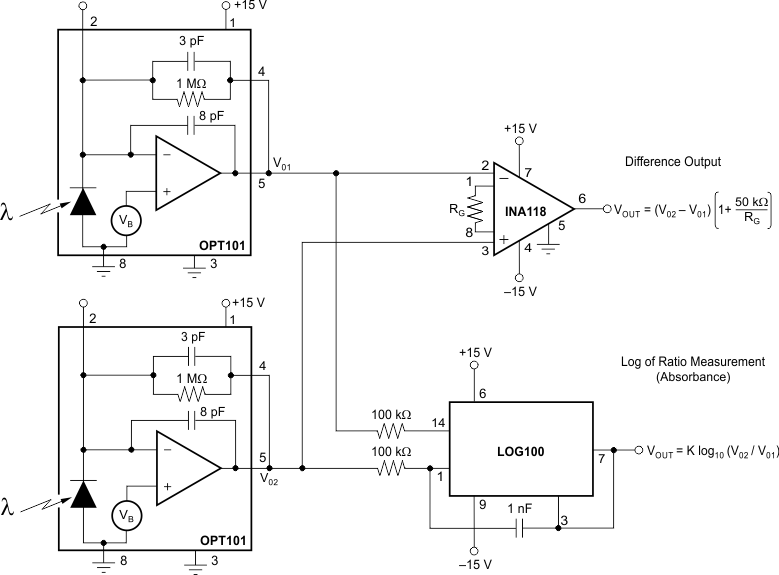 Figure 28. Differential Light Measurement
9.2.4 LED Output Regulation Circuit
To keep an LED (or other light) producing a constant amount of light over changing temperature and over the lifetime efficiency degradation of the LED, use a circuit similar to Figure 29. As the efficiency of the LED degrades, this circuit increases the LED drive current to keep the output at the appropriate constant level.
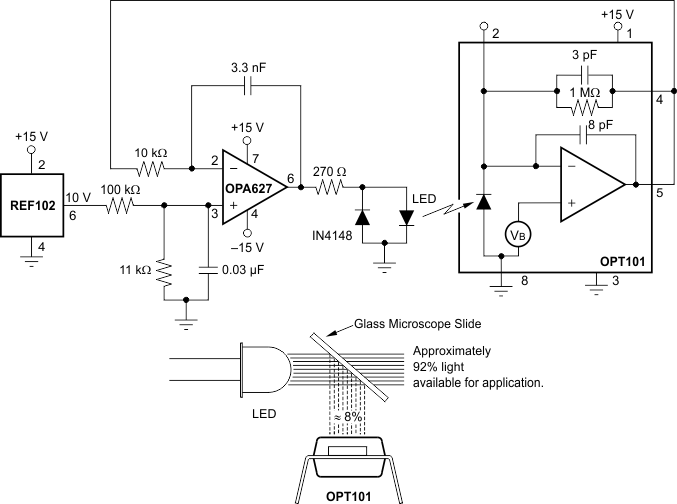 Figure 29. LED Output Regulation Circuit
9.3 Dos and Don'ts
As with any optical product, special care must be taken into consideration when handling the OPT101. Although the OPT101 has low sensitivity to dust and scratches, proper optical device handling procedures are still recommended.
The optical surface of the device must be kept clean for optimal performance in both prototyping with the device and mass production manufacturing procedures. Tweezers with plastic or rubber contact surfaces are recommended to avoid scratches on the optical surface. Avoid manipulation with metal tools when possible. The optical surface must be kept clean of fingerprints, dust, and other optical-inhibiting contaminants.
If the device optical surface requires cleaning, use deionized water or isopropyl alcohol. A few gentile brushes with a soft swab are appropriate. Avoid potentially abrasive cleaning and manipulating tools and excessive force that can scratch the optical surface.
If the OPT101 performs less than optimally, inspect the optical surface for dirt, scratches, or other optical artifacts.
Any light falling on the op amp circuitry area must be uniform; see the Parameter Measurement Information section for more information about light uniformity.