SCLS020H March 1984 – December 2022 SN54HCT245 , SN74HCT245
PRODUCTION DATA
- 1 Features
- 2 Applications
- 3 Description
- 4 Revision History
- 5 Pin Configuration and Functions
- 6 Specifications
- 7 Parameter Measurement Information
- 8 Detailed Description
- 9 Application and Implementation
- 10Power Supply Recommendations
- 11Layout
- 12Device and Documentation Support
- 13Mechanical, Packaging, and Orderable Information
Package Options
Refer to the PDF data sheet for device specific package drawings
Mechanical Data (Package|Pins)
- DB|20
- NS|20
- N|20
- DGS|20
- DW|20
- PW|20
Thermal pad, mechanical data (Package|Pins)
Orderable Information
9.2.3 Application Curve
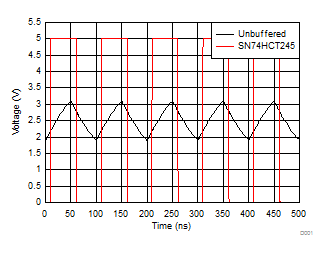
It is common to see significant losses in ribbon cables and back planes. The plot shown in Figure 9-2 is a simplified simulation of a ribbon cable from a 5-V, 10-MHz low drive strength source. It shows the difference between an input signal from a weak driver like an MCU or FPGA compared to a strong driver like the SN74HCT245 when measured at the distant end of the cable. By adding a high-current drive transceiver before the cable, the signal strength can be significantly improved, and subsequently the cable can be longer.

Unbuffered line is directly connected to low current source, SN74HCT245 line is buffered through the transceiver. Both signals are measured at the distant end of the ribbon cable.
Figure 9-2 Simulated Outputs From Ribbon Cable With a 5-V, 10-MHz Source