SNAS647D February 2015 – March 2016 TDC7200
PRODUCTION DATA.
- 1 Features
- 2 Applications
- 3 Description
- 4 Revision History
- 5 Companion Device
- 6 Pin Configuration and Functions
- 7 Specifications
-
8 Detailed Description
- 8.1 Overview
- 8.2 Functional Block Diagram
- 8.3 Feature Description
- 8.4 Device Functional Modes
- 8.5 Programming
- 8.6
Register Maps
- 8.6.1 Register Initialization
- 8.6.2 CONFIG1: Configuration Register 1 R/W (address = 00h) [reset = 0h]
- 8.6.3 CONFIG2: Configuration Register 2 R/W (address = 01h) [reset = 40h]
- 8.6.4 INT_STATUS: Interrupt Status Register (address = 02h) [reset = 00h]
- 8.6.5 INT_MASK: Interrupt Mask Register R/W (address = 03h) [reset = 07h]
- 8.6.6 COARSE_CNTR_OVF_H: Coarse Counter Overflow High Value Register (address = 04h) [reset = FFh]
- 8.6.7 COARSE_CNTR_OVF_L: Coarse Counter Overflow Low Value Register (address = 05h) [reset = FFh ]
- 8.6.8 CLOCK_CNTR_OVF_H: Clock Counter Overflow High Register (address = 06h) [reset = FFh]
- 8.6.9 CLOCK_CNTR_OVF_L: Clock Counter Overflow Low Register (address = 07h) [reset = FFh]
- 8.6.10 CLOCK_CNTR_STOP_MASK_H: CLOCK Counter STOP Mask High Value Register (address = 08h) [reset = 00h]
- 8.6.11 CLOCK_CNTR_STOP_MASK_L: CLOCK Counter STOP Mask Low Value Register (address = 09h) [reset = 00h]
- 8.6.12 TIME1: Time 1 Register (address: 10h) [reset = 00_0000h]
- 8.6.13 CLOCK_COUNT1: Clock Count Register (address: 11h) [reset = 00_0000h]
- 8.6.14 TIME2: Time 2 Register (address: 12h) [reset = 00_0000h]
- 8.6.15 CLOCK_COUNT2: Clock Count Register (address: 13h) [reset = 00_0000h]
- 8.6.16 TIME3: Time 3 Register (address: 14h) [reset = 00_0000h]
- 8.6.17 CLOCK_COUNT3: Clock Count Registers (address: 15h) [reset = 00_0000h]
- 8.6.18 TIME4: Time 4 Register (address: 16h) [reset = 00_0000h]
- 8.6.19 CLOCK_COUNT4: Clock Count Register (address: 17h) [reset = 00_0000h]
- 8.6.20 TIME5: Time 5 Register (address: 18h) [reset = 00_0000h]
- 8.6.21 CLOCK_COUNT5: Clock Count Register (address: 19h) [reset = 00_0000h]
- 8.6.22 TIME6: Time 6 Register (address: 1Ah) [reset = 00_0000h]
- 8.6.23 CALIBRATION1: Calibration 1 Register (address: 1Bh ) [reset = 00_0000h]
- 8.6.24 CALIBRATION2: Calibration 2 Register (address: 1Ch ) [reset = 00_0000h]
- 9 Application and Implementation
- 10Power Supply Recommendations
- 11Layout
- 12Device and Documentation Support
- 13Mechanical, Packaging, and Orderable Information
Package Options
Mechanical Data (Package|Pins)
- PW|14
Thermal pad, mechanical data (Package|Pins)
Orderable Information
9 Application and Implementation
NOTE
Information in the following applications sections is not part of the TI component specification, and TI does not warrant its accuracy or completeness. TI’s customers are responsible for determining suitability of components for their purposes. Customers should validate and test their design implementation to confirm system functionality.
9.1 Application Information
In the Time Of Flight (TOF) method, the upstream flight time as well as the downstream flight time is measured. The difference between the Downstream and Upstream values is proportional to the flow.
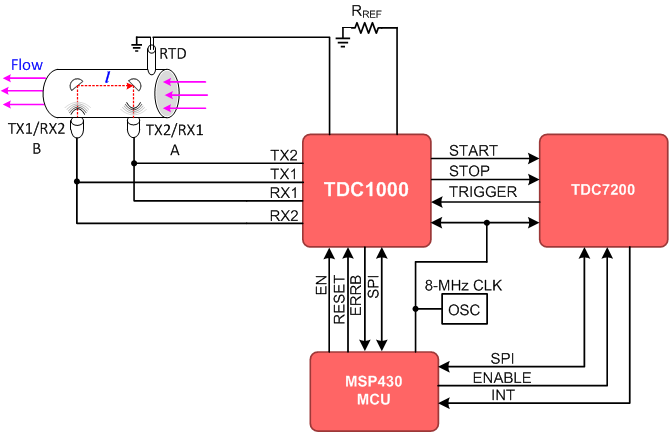
The microcontroller (MCU) configures the TDC and AFE and issues a measurement start command to the TDC via the SPI interface. The TDC sends a TRIGGER pulse to the AFE which is set up to actuate one of the transducers and transmit a START signal to the TDC which starts its counter(s). The echo pulse will travel through the AFE and arrive to the TDC as the STOP signal. The counter will be stopped and after performing calibration, the counter value is reported as VAL.
Depending on system implementation, the above procedure is repeated for the same direction or opposite direction.
9.2 Typical Application
 Figure 45. System in Time of Flight Mode
9.2.1 Design Requirements
The parameters in this section are considered for this example.
Table 25. Design Parameters
| DESIGN PARAMETER | EXAMPLE VALUE |
|---|---|
| Pipe diameter | 15 mm |
| Distance between transducers | 60 mm |
| Minimum flow rate | 0.015 m3/h |
| Accuracy at minimum flow rate | 5% |
The design of flow-meters requires a thorough technical assessment of the system where the device will be used. The following is a list of areas to consider:
- Minimum and maximum flow rate at maximum allowable error in the system
- Transitional flow rate
- Instantaneous and total quantity pumped over time
- Accuracy of the meter within prescribed limits per applicable standards
- Pressure in the system
- Operating temperature range
The appropriate ultrasonic sensor and the proper electronics for interfacing to the sensor are determined based on the system requirements. The following is a list of specifications applicable to the senor/assembly used in the system:
- Excitation frequency
- Excitation source voltage
- Pipe diameter
- Distance between the transducers (or reflectors)
9.2.2 Detailed Design Procedure
The following subsections describe the detailed design procedure for a flow meter application.
9.2.2.1 Flow Meter Regulations and Accuracy
If the flow meter is intended for residential applications, it must be designed to meet the required standards. For example, per the INTERNATIONAL ORGANIZATION OF LEGAL METROLOGY (OIML), the metrological requirements of water meters are defined by the values of Q1, Q2, Q3 and Q4, which are described in Table 26.
Table 26. Flow-rate Zones per OIML
| FLOW-RATE ZONE | DESCRIPTION |
|---|---|
| Q1 | Lowest flow rate at which the meter is to operate within the maximum permissible errors. |
| Q2 | Flow rate between the permanent flow rate and the minimum flow rate that divides the flow rate range into two zones, the upper flow rate zone and the lower flow rate zone, each characterized by its own maximum permissible errors. |
| Q3 | Highest flow rate within the rated operating condition at which the meter is to operate within the maximum permissible errors. |
| Q4 | Highest flow rate at which the meter is to operate for a short period of time within the maximum permissible errors, while maintaining its metrological performance when it is subsequently operating within the rated operating conditions. |
A water meter is designated by the numerical value of Q3 in m3/h and the ratio Q3/Q1. The value of Q3 and the ratio of Q3/Q1 are selected from the lists provided in the OIML standards.
Water meters have to be designed and manufactured such that their errors do not exceed the maximum permissible errors (MPE) defined in the standards. For example, in OIML standards, water meters need to be designated as either accuracy class 1 or accuracy class 2, according to the requirements.
For class 1 water meters, the maximum permissible error in the upper flow rate zone (Q2 ≤ Q ≤ Q4) is ±1%, for temperatures from 0.1°C to 30°C, and ±2% for temperatures greater than 30°C. The maximum permissible error for the lower flow-rate zone (Q1 ≤ Q < Q2) is ±3%, regardless of the temperature range.
For class 2 water meters, the maximum permissible error for the upper flow rate zone (Q2 ≤ Q ≤ Q4) is ±2%, for temperatures from 0.1°C to 30°C, and ±3% for temperatures greater than 30°C. The maximum permissible error for the lower flow rate zone (Q1 ≤ Q < Q2) is ±5% regardless of the temperature range.
The flow meter accuracy specified in the standards dictates the required accuracy in the electronics used for driving the ultrasonic transducers, circuits in the receiver path, and time measurement sub circuits. The stringent accuracy required at lower flow rates would require a very low noise signal chain in the transmitter and receiver circuits used in ultrasonic flow meters, as well as the ability to measure picosecond time intervals.
9.2.2.2 Transmit Time in Ultrasonic Flow Meters
Transit-time ultrasonic flow meters works based on the principle that sound waves in a moving fluid travel faster in the direction of flow (downstream), and slower in the opposite direction of flow (upstream).
The system requires at least two transducers. The first transducer operates as a transmitter during the upstream cycle and as a receiver during the downstream cycle, and the second transducer operates as a receiver during the upstream cycle and as a transmitter during the downstream cycle. An ultrasonic flow meter operates by alternating transmit and receive cycles between the pair of transducers and accurately measuring the time-of-flight both directions.
In this example, the upstream TOF is defined as:

where
- l is the path length between the two transducers in meters (m)
- c is the speed of sound in water in meters per second (m/s)
- v is the velocity of the water in the pipe in meters per second (m/s)
In this example, the downstream TOF is defined as:

where
- l is the path length between the two transducers in meters (m)
- c is the speed of sound in water in meters per second (m/s)
- v is the velocity of the water in the pipe in meters per second (m/s)
The difference of TOF is defined as:

where
- tBA is the upstream TOF from transducer B to transducer A in seconds (s)
- tAB is the downstream TOF from transducer A to transducer B in seconds (s)
After the difference in time-of-flight (ΔTOF) is calculated, the water velocity inside the pipe can be related to the ΔTOF using the following equation:

where
- c is the speed of sound in water in meters per second (m/s)
- l is the path length between the two transducers in meters (m)
Finally, the mass flow rate can be calculated as follows:

where
- k is the flow-meter constant
- v is the velocity of the water in the pipe in meters per second (m/s)
- A is the cross-section area of the pipe in meters-squared (m2)
9.2.2.3 ΔTOF Accuracy Requirement Calculation
Based on the minimum mass flow requirement and accuracy requirements in Table 25, the ΔTOF accuracy needed can be calculated as follows:
- Convert the mass flow rate to m3/s:
- Calculate the flow velocity assuming k = 1:
- Calculate the ΔTOF for the given speed of sound. In this example, a speed of sound c = 1400 m/s is assumed:
- The requirement of 5% accuracy for minimum flow will result in a ΔTOF accuracy of:


For this reason, this system requires a high accuracy timer/stopwatch that can measure the lower flow rate state.
The TDC1000 ultrasonic analog-front-end is used to drive the transmitter, amplify and filter the received signal and conditioning the echo for START and STOP pulse generation. The TDC7200 ps-accurate timer is used to measure the time interval between the rising edge of the START pulse and the rising edge of the STOP pulse produced by the TDC1000.
The microcontroller should first configure the TDC7200 and the TDC1000 for the measurement. When the microcontroller issues a start command to the TDC7200 via the SPI interface, the TDC7200 sends a trigger pulse to the TRIGGER pin of the TDC1000. When the TDC1000 drives the transmit transducer, a synchronous START pulse is produced on the START pin, which commands the TDC7200 to start its counters. When a valid echo pulse is received on the receive transducer, the TDC1000 generates a STOP pulse on the STOP pin, which commands the TDC7200 to stop its counters. This procedure is repeated for the upstream and downstream cycles.
A temperature measurement can be performed and the result can be used to correct for temperature dependency of the speed of sound.
9.2.3 Application Curves
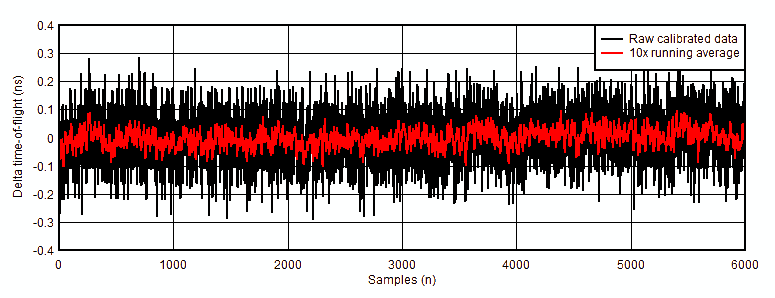
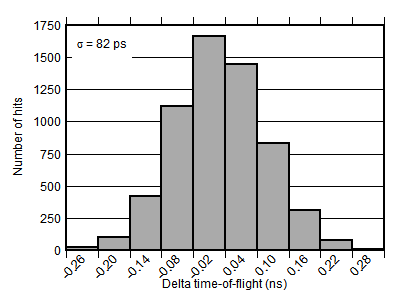
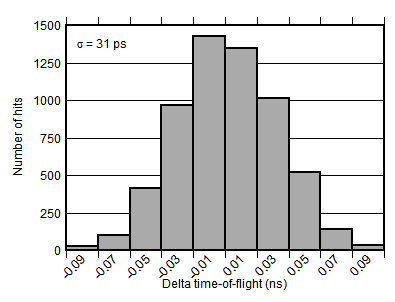
Figure 46 , Figure 47, and Figure 48 show data and histograms created with data collected under a zero flow condition at room temperature. A simple offset calibration has been applied, where the overall average of the data is subtracted from the data.
 Figure 46. Calibrated Raw and Averaged Delta Time-of-Flight Data
 Figure 47. Raw Calibrated Data Histogram
 Figure 48. 10x Running Average Data Histogram
9.3 Post Filtering Recommendations
For application such as flow meters where conversion results are accumulated over a long period of time, post filtering is not required. However, for applications where a specific action is taken based on individual conversion results, post filtering is recommended. One advantage of post filtering is to remove the conversion results that are outside of the normal distribution.
One such post filtering method commonly applied by an MCU is the Median Filter Method. The median of a finite number of conversion results can be found by arranging all the conversions from the lowest value to the highest value, and picking the middle one. For example, a conversion result of {50, 51, 49, 40, 51} can be rearranged from lowest to highest {40, 49, 50, 51, 51}, and the median value after applying the Median Filter Method is 50.
9.4 CLOCK Recommendations
A stable, known reference clock is crucial to the ability to measure time, regardless of the time measuring device. Two parameters of a clock source primarily affect the ability to measure time: accuracy and jitter. The following subsections will discuss recommendations for the CLOCK in order to increase accuracy and reduce jitter.
9.4.1 CLOCK Accuracy
CLOCK sources are typically specified with an accuracy value as the clock period is not exactly equal to the nominal value specified. For example, an 8 MHz clock reference may have a 20 ppm accuracy. The true value of the clock period therefore has an error of ±20ppm, and the real frequency is in the range 7.99984 MHz to 8.00016 MHz [8 MHz ± (8 MHz) x (20/106)].
If the clock accuracy is at this boundary, but the reference time used to calculate the time of flight relates to the nominal 8 MHz clock period, then the time measured will be affected by this error. For example, if the time period measured is 50 µs, and the 8MHz reference clock has +50ppm of error in frequency, but the time measured refers to the 125 ns period (1/8 MHz), then the 50 µs time period will have an error of 50µs x 50/1000000 = 2.5 ns.
In summary, a clock inaccuracy translates proportionally to a time measurement error.
9.4.2 CLOCK Jitter
Clock jitter introduces uncertainty into a time measurement, rather than inaccuracy. As shown in Figure 49, the jitter accumulates on each clock cycle so the uncertainty associated to a time measurement is a function of the clock jitter and the number of clock cycles measured.
Clock_Jitter_Uncertainty = (√n) x (θJITTER), where n is the number of clock cycles counted, and θJITTER is the cycle-to-cycle jitter of the clock.
For example, if the time measured is 50 µs using an 8 MHz reference clock, n = 50 µs/(1/8 MHz) = 400 clock cycles. If the RMS cycle-to-cycle jitter, θJITTER = 10 ps, then the RMS uncertainty introduced in a single measurement is in the order of (√n) x (θJITTER) = 200 ps.
Because the effect of jitter is random, averaging or accumulating time results reduces the effect of the uncertainty introduced. If the time is measured m times and the result is averaged, then the uncertainty is reduced to: Clock_Jitter_Uncertainty = (√n) x (θJITTER) / (√m).
For example, if 64 averages are performed in the example above, then the jitter-related uncertainty is reduced to 25 ps RMS.
 Figure 49. CLOCK Jitter