SBAU126E may   2007  – june 2023 ADS1158 , ADS1258


  1.   1
  2.   Abstract
  3.   Trademarks
  4. 1ADS1258EVM Overview
    1. 1.1 ADS1258EVM Kit
    2. 1.2 ADS1258EVM
  5. 2Getting Started With the ADS1258EVM
  6. 3Analog Interface
    1. 3.1 Analog Input Options
    2. 3.2 ADC Connections and Decoupling
    3. 3.3 Configurable Multiplexer Loop
      1. 3.3.1 Measuring Single-Ended Inputs Using a Pseudo-Differential Configuration
    4. 3.4 Clocking
    5. 3.5 Voltage Reference
  7. 4Digital Interface
    1. 4.1 GPIO
  8. 5Power Supplies
  9. 6Software Installation
  10. 7EVM Operation and GUI
    1. 7.1 Connecting the Hardware
    2. 7.2 EVM GUI Global Settings for ADC Control
    3. 7.3 Time-Domain Display
    4. 7.4 Frequency-Domain Display
    5. 7.5 Histogram Display
  11. 8Bill of Materials, Layout, and Schematics
    1. 8.1 Bill of Materials
    2. 8.2 EVM PCB Layout
    3. 8.3 Schematics
  12. 9Revision History

Frequency-Domain Display

Figure 7-5 shows the spectral analysis tool that evaluates the dynamic performance (SNR, THD, SFDR, SINAD, and ENOB) of the ADS1258. This dynamic performance is calculated by single-tone sinusoidal signal FFT analysis using the 7-term Blackman-Harris window setting. The FFT tool includes windowing options that are required to mitigate the effects of non-coherent sampling (this discussion is beyond the scope of this document). The 7-term Blackman-Harris window is the default option and has sufficient dynamic range to resolve the frequency components of a 24-bit ADC. The None option corresponds to not using a window (or using a rectangular window) and is not recommended.
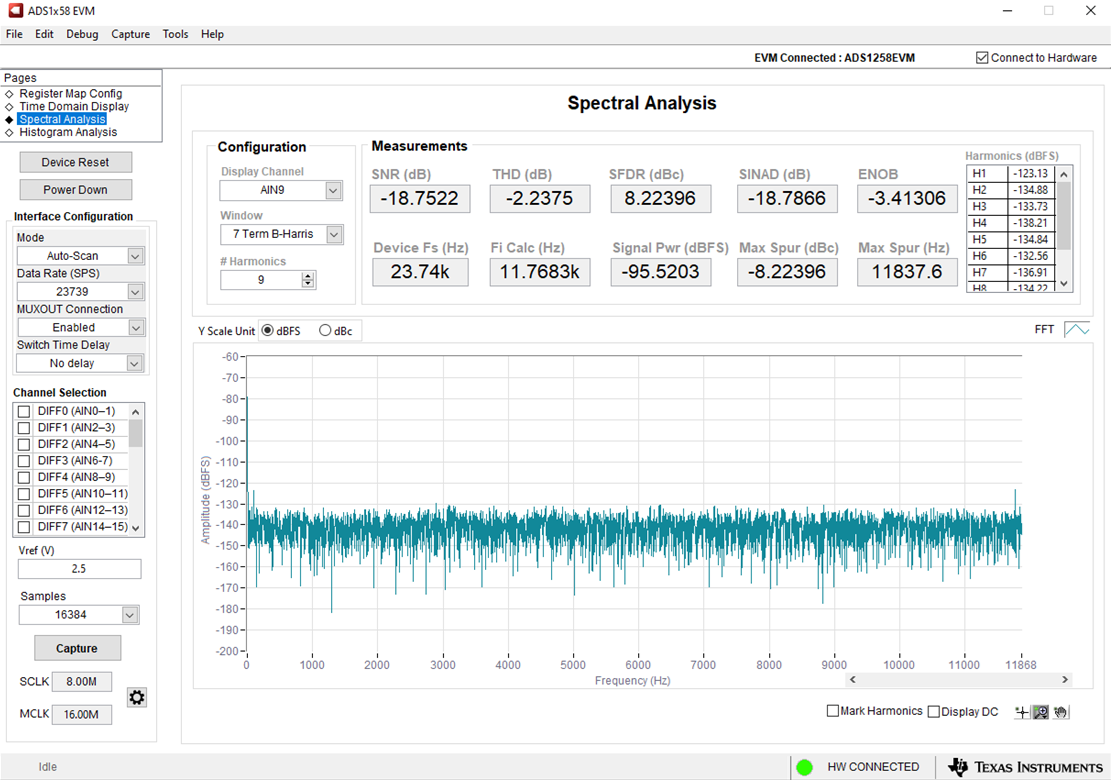
GUID-20221026-SS0I-DHRC-CW8Z-Q3VGCJQFRGXN-low.png Figure 7-5 ADS1258EVM GUI Frequency Domain Display Page