SLVAFG6A December 2022 – November 2023 TPS25762-Q1 , TPS25772-Q1
4.1 Thermal Foldback Operation
The TPS257xx-Q1 PD controller monitors system temperature using an external thermistor or I2C temperature sensor. Based on the configurable temperature thresholds, the SPM can reduce USB port power in response to temperature increases. Depending on the voltage output level from the thermistor/temperature sensor, the SPM will enter or exit an appropriate thermal phase and re-negotiate the contract with a connected Port Partner to help with the thermal performance of the system.
In systems that use both an external thermistor and I2C temperature sensor, the SPM collects a thermal phase value from each device then uses the highest phase parameter to enter the appropriate power mode for all ports. The voltage thresholds for the thermal phases for each temperature sensing device can be varied. This is to accommodate variations in temperature which would be dependent upon the placement of the thermistor/temperature sensor, USB PD controller, and other temperature related physical properties.
There are three default thermal phases based on the voltage level detected on the TPS257xx-Q1's NTC pin input or readings from an I2C temperature sensor, but three additional thermal phases can be added using the GUI for a total of six. The GUI is also used to configure the voltage thresholds and the max power for each phase. Figure 4-1 shows the NTC input voltage thresholds of a three thermal phase configuration where Phase3 represents the worst case with the highest temperature.
 Figure 4-1 NTC Input Voltage Threshold and Thermal Phase
Rising or falling voltages on the NTC pin indicate increasing or decreasing system temperatures, respectively. To achieve a positive temperature slope on the TPS25772-Q1 NTC pin, thermistor resistor networks should be connected to LDO_3v3 as shown in Figure 4-2. The device firmware monitors the voltage level on the NTC pin then enters or exits the thermal phase per the configured values. For more information on the NTC input, see device data sheets.
 Figure 4-2 Thermistor Implementation Options
Table 4-1 shows the Thermal Phase Parameters that are configured through the GUI.
| Thermal Phase Parameters | Description |
|---|---|
| Phasen Vth_R(1) | Thermal Phasen entry threshold. Device enters Thermal Phasen upon detection of rising edge above this voltage threshold. |
| Phasen Vth_F(1) | Thermal Phasen exit threshold. Device exits Thermal Phasen upon detection of falling edge below this voltage threshold. |
| Phasen Max Power(1) | Maximum total power in Thermal Phasen. SPM uses Thermal Phasen Max Power to execute port power management actions once device enters Thermal Phasen. |
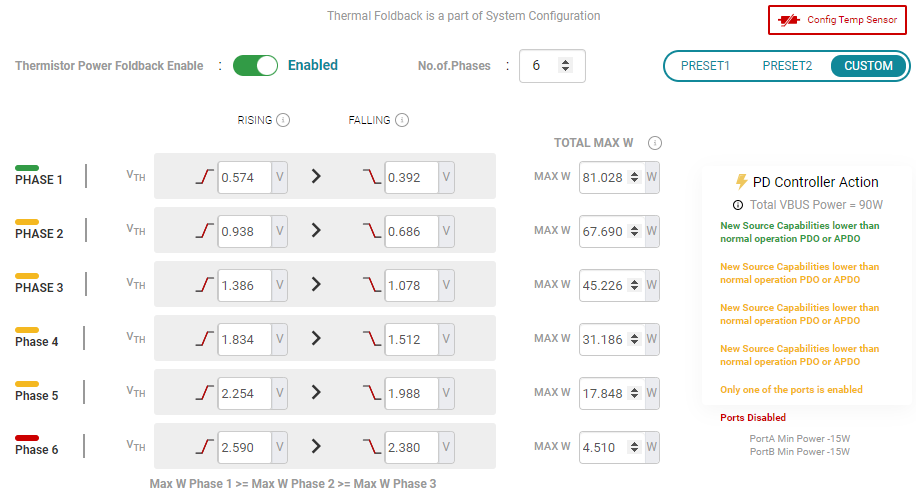
Figure 4-3 shows the GUI entry example in Advanced Configuration View where the No. of Phases is configured to 6.
 Figure 4-3 Thermal Foldback GUI Entry
Example
 The Thermal Phase Parameters must be configured per the rules described below:
- Thermal Phase6 power(W)<=Thermal Phase5 power(W)<=Thermal Phase4 power (W)<=Thermal Phase3 power (W)<=Thermal Phase2 power (W)<=Thermal Phase1 power (W)
- Phase*_Vth_R (V) > Phase*_Vth_F (V)
Note that if Total Max W for any phase is less than SUM (Port Min Power), VBUS is disabled (0 V) upon entry into the corresponding phase. For example if Phase3 Max Power = 7.5 W while SUM(Port Min Power) = 30 W, VBUS will be disabled upon entry into Phase3
The TPS257xx-Q1 is designed to work with LM75 type temperature sensor: TMP75-Q1. The SPM polls the I2C sensor ADC register at a configured interval, with a default typical polling interval value of 250 ms. The ADC reading from the temperature sensor is converted to 1°C resolution.
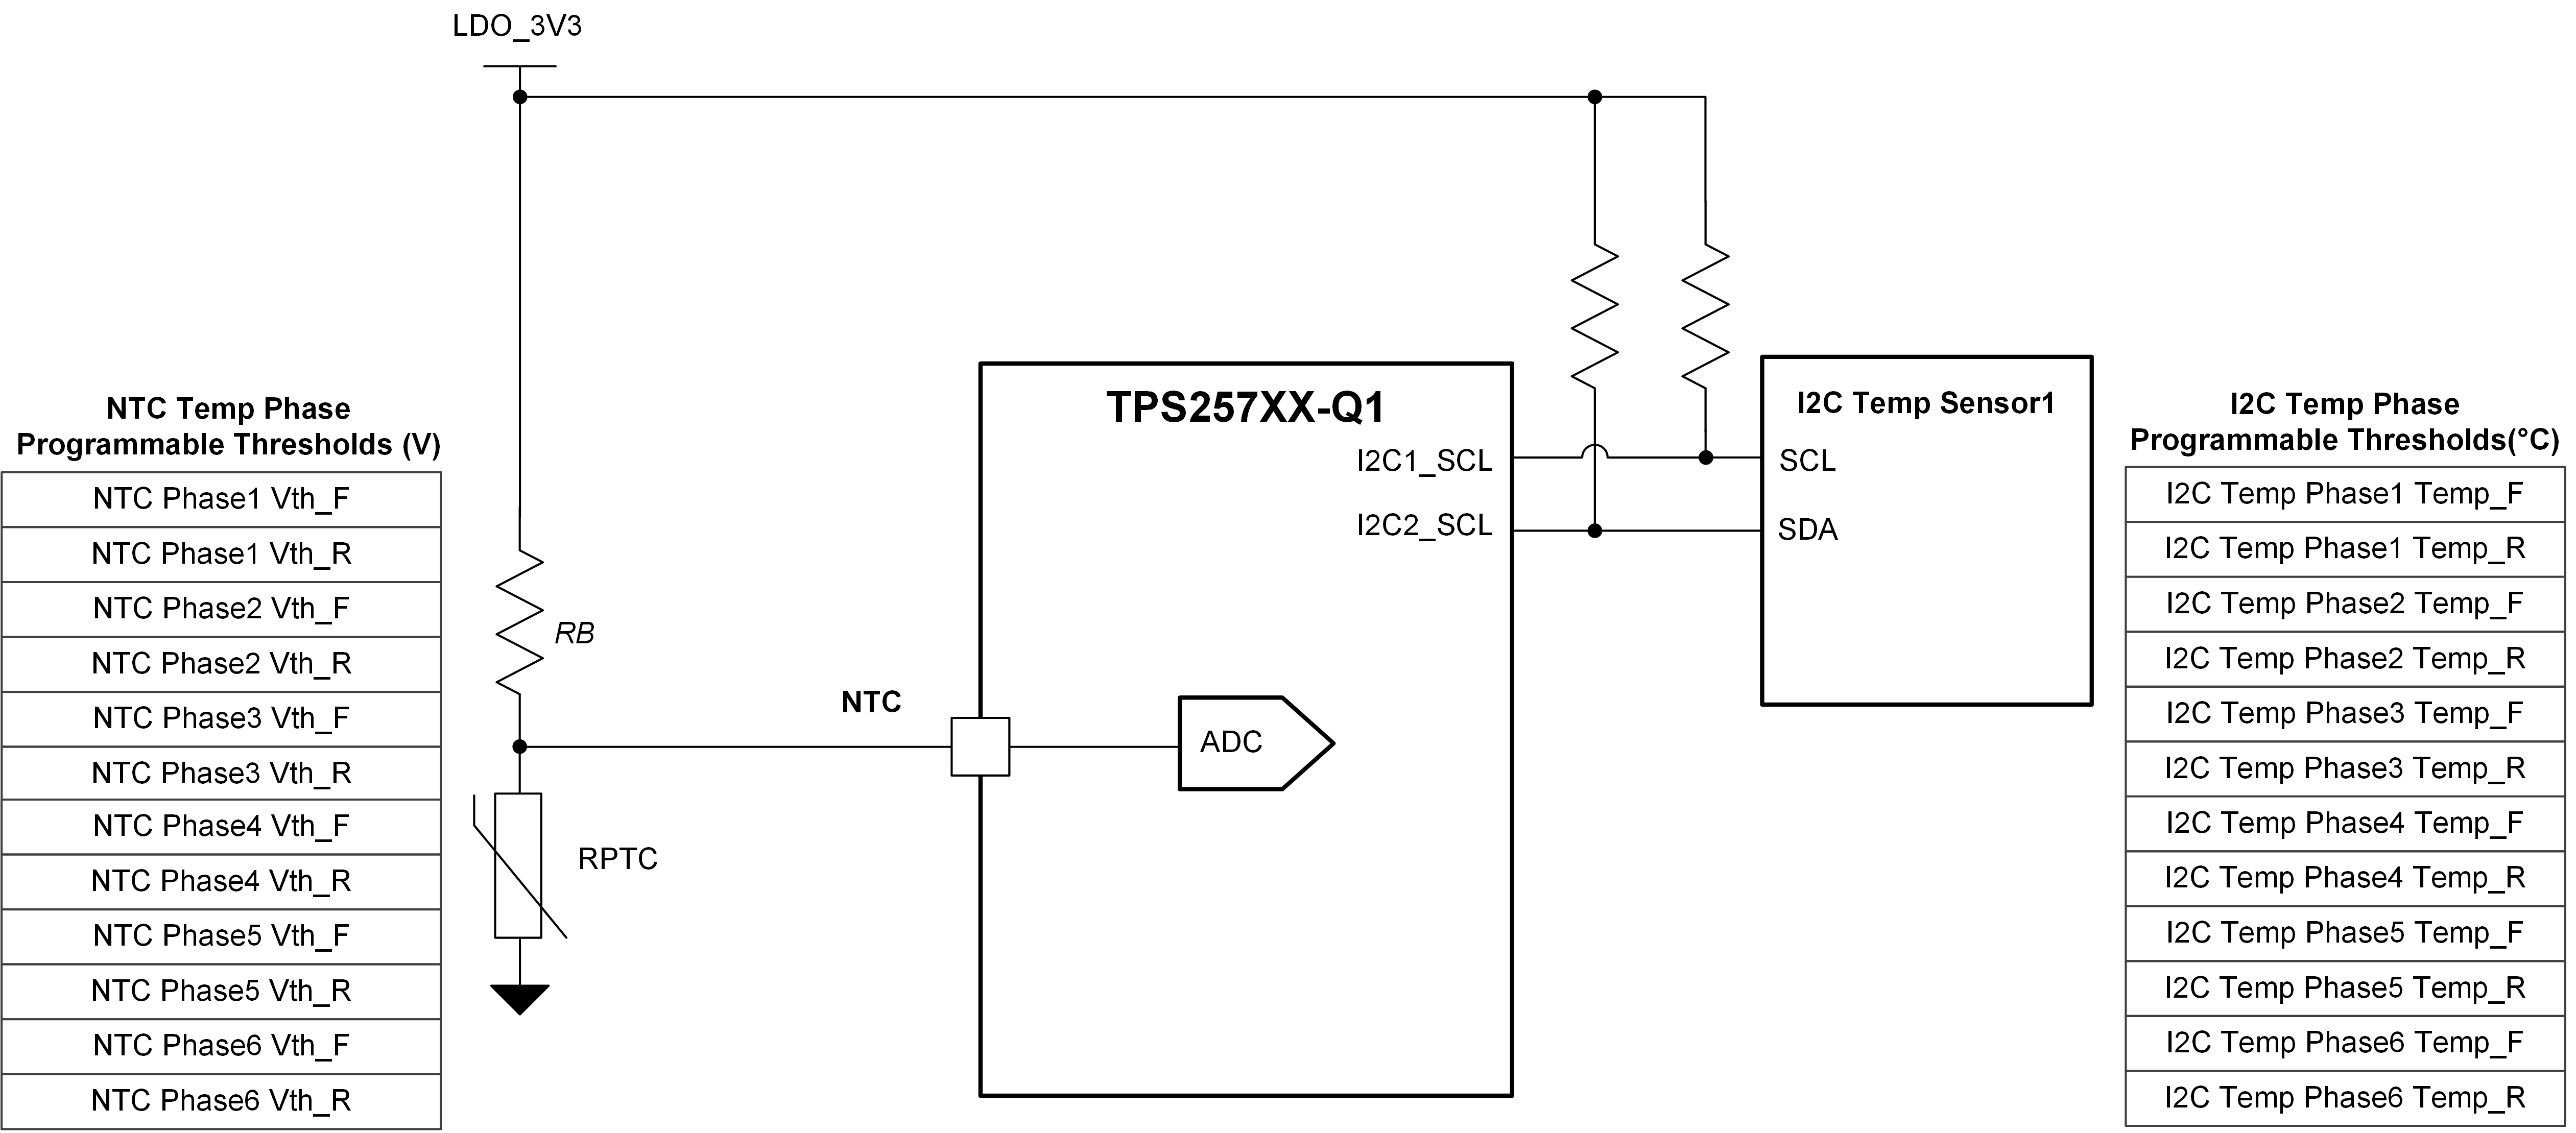
Figure 4-4 depicts the connection of the thermistor and I2C temperature sensor to the TPS257xx-Q1.
 Figure 4-4 I2C Temp Sensor and Thermistor Configuration Example
TPS257xx-Q1 supports multiple thermal detection devices in one system. A thermistor and an I2C temperature sensor can be both connected and monitored as shown in Figure 4-4. The NTC Phase and I2C temperature phase thresholds can be configured separately. Thermistor phase thresholds are configured in voltage while I2C temperature sensor phase thresholds are configured in the Celsius temperature scale. The SPM chooses the worst value of the Thermistor and I2C Temperature thermal phase, then takes action to reduce power per the worst phase configuration.
Table 4-2 and Table 4-3 show a three-phase NTC thermistor and I2C temperature sensor parameters for the following example scenarios. Note that the temperature thresholds and a phase's Total Max Power can be configured independently of each other.
| Vth | Temperature | Total Max Power | |
|---|---|---|---|
| NTC Phase1 Vth_F | 0.83 V | 65°C | 45 W |
| NTC Phase1 Vth_R | 1.1 V | 70°C | |
| NTC Phase2 Vth_F | 1.2 V | 78°C | 30 W |
| NTC Phase2 Vth_R | 1.4 V | 90°C | |
| NTC Phase3 Vth_F | 1.5 V | 95°C | 7.5 W |
| NTC Phase3 Vth_R | 1.7 V | 105°C |
| Temperature | Total Max Power | |
|---|---|---|
| I2C temp sensor Phase1 F | 42°C | 45 W |
| I2C temp sensor Phase1 R | 45°C | |
| I2C temp sensor Phase2 F | 49°C | 30 W |
| I2C temp sensor Phase2 R | 53°C | |
| I2C temp sensor Phase3 F | 59°C | 15 W |
| I2C temp sensor Phase3 R | 64°C |
The following are two examples of Thermal Foldback where the NTC and I2C temperature sensor readings steadily increased and have crossed their rising thresholds.
Case 1. NTC thermistor Vth reading = 1.3 V( around 85°C), I2C temperature sensor temperature reading = 63°C.
Per the configuration shown in Table 4-2 and Table 4-3, the NTC reading indicates the thermistor is in Phase1 while the I2C temperature sensor is in Phase2. The SPM uses the I2C temperature Phase2 as its worse phase, then reduces power per I2C temp sensor Phase2 configuration of 30 W.
Case 2. NTC Phase Vth reading = 1.72 V (around 106°C), I2C temperature sensor temperature reading = 65°C.
Per the configuration shown Table 4-2 and Table 4-3, both NTC and I2C sensor readings are in Phase3. The Phase3 power configuration for NTC thermistor is 7.5 W while I2C temp sensor is 15 W. The SPM takes the lower of two then reduces power to 7.5 W.